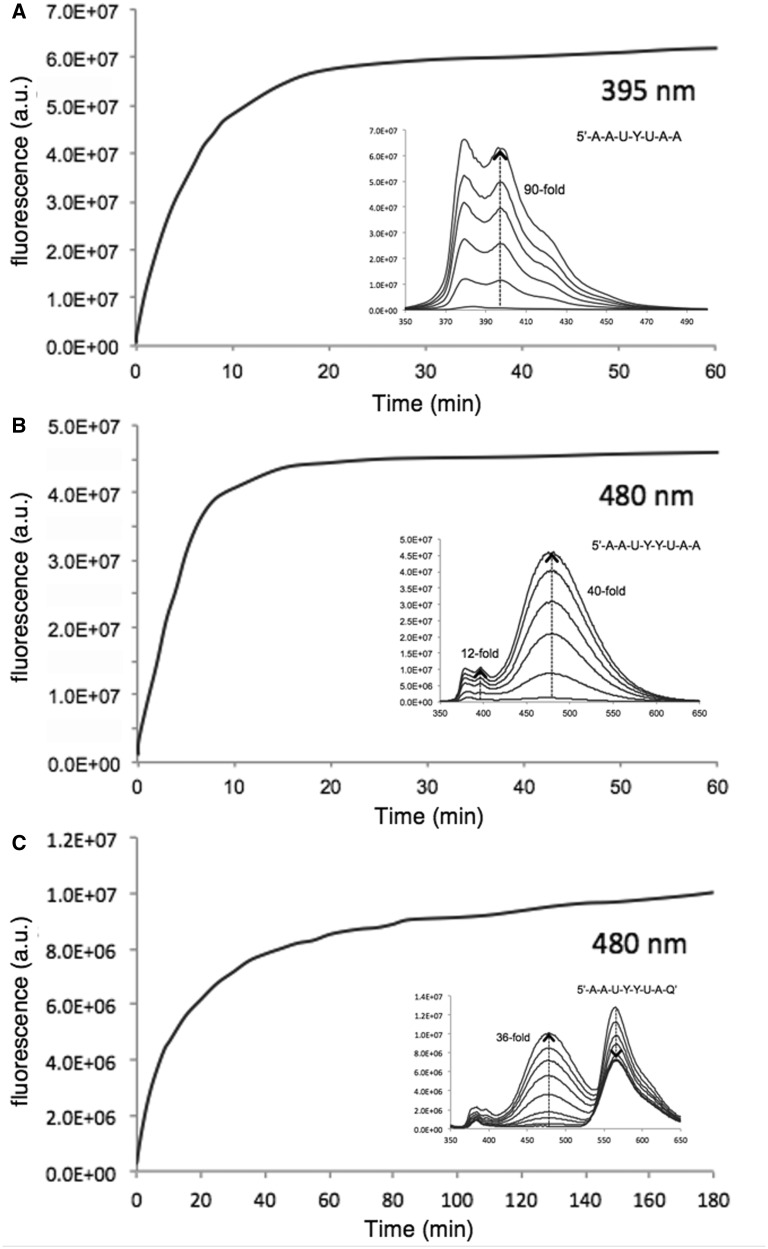
Figure 2.
In vitro enzymatic responses of probes 1 (A), 2 (B), and 3 (C) with E. coli UDG. Time courses of fluorescence response are shown at the indicated wavelengths; insets show full spectral changes over the same time course. Conditions: 400 nM probe, UDG 1 U/ml (0.4 nM), 37°C, excitation 340 nm.

