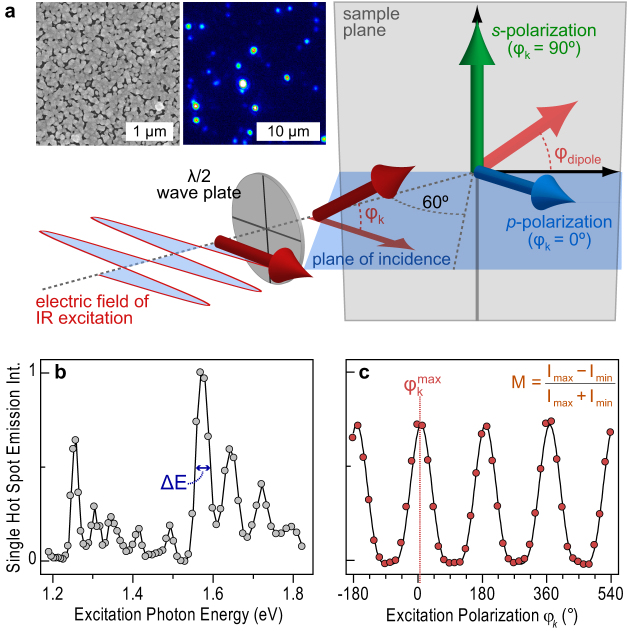
Figure 1. Excitation spectroscopy and polarization anisotropy of single nonlinear hot spots in a high-coverage, semicontinuous silver film grown following the Tollens mirror reaction.
(a) Under illumination of obliquely incident, pulsed infrared radiation, the film exhibits surface-enhanced upconverted supercontinuum emission from discrete, diffraction-limited spots. Typical SEM and fluorescence micrographs are shown. (b) Excitation spectrum of a single hot spot where the emission intensity is plotted as a function of the IR photon energy. The black line serves as a guide to the eye. The hot spot exhibits multiple resonances that are each characterized by their FWHM, ΔE. (c) Excitation polarization anisotropy measurements on single hot spots. The emission intensity is recorded as a function of the angle of the electric field vector from the horizontal, φk, defined in the cartoon, and can be fitted with a cos4 function (black line). The coupling to polarized excitation is characterized by the polarization anisotropy value M, defined in the inset, and the in-plane dipole angle, φdipole, which is determined from the angle of maximum emission  .
.

