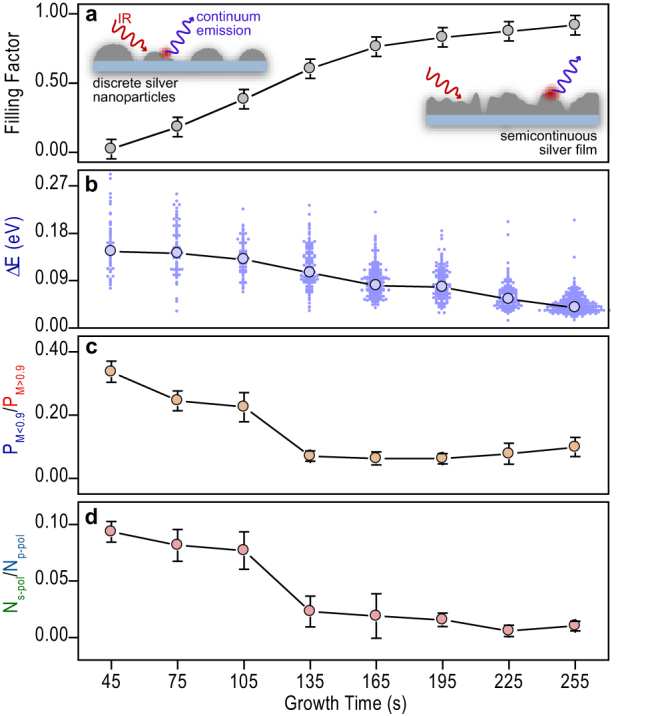
Figure 3. Transformation of plasmon modes with surface coverage as probed by nonlinear excitation of single hot spots.

(a) The two-dimensional filling factor is used to describe surface coverage, showing an approximately monotonic increase with growth time. For low-coverage films, the plasmon modes are dictated by LSPRs of silver nanoparticles that are diffractively coupled to one-another, while the higher-coverage films are characterized by delocalized modes as is illustrated in the insets. (b) The average resonance width plotted on top of the corresponding distribution of data points shows a clear narrowing with growth time. The small data points describe the underlying distribution of resonance widths at the specified growth time and the horizontal breadth of the points reflects the occurrence frequency. The ratio between unpolarized to polarized (c) and s-polarized to p-polarized (d) hot spots shows a step-like drop with increasing growth time between 105 s and 135 s.
