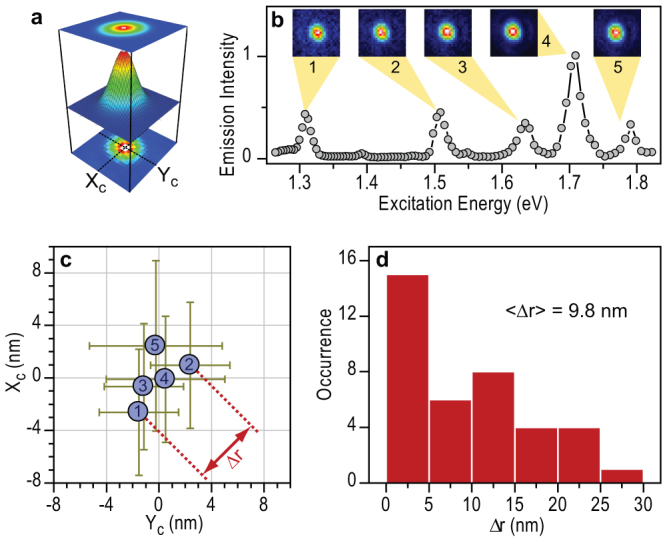
Figure 4. Super-resolution localization microscopy of single multi-resonant nonlinear hot spots.

(a) The centroid of the diffraction-limited hot spot image is extracted from a two-dimensional Gaussian fit. (b) Excitation spectrum of a single hot spot with corresponding microscope images. The hot spot centroid at each resonance was recorded 20 times in an alternating fashion. (c) Resulting spatial localization of the hot spot at each resonance with respect to the average value, illustrating that the centroid at each resonance is localized within a region of ~6 nm. Repeating this measurement for 5 additional hot spots that included 25 distinct resonances provides a distribution of spatial shifts of the centroid position between resonances and shows that multi-resonant hot spots are localized within an average region of ~10 nm.
