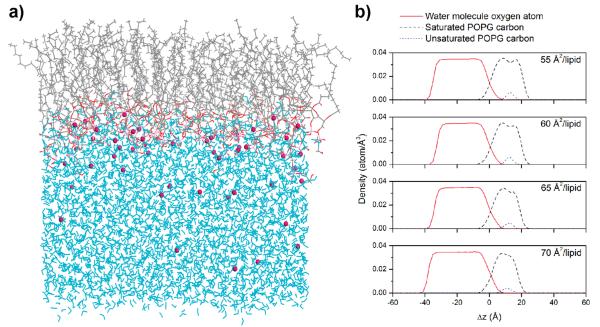
Figure 5.
(a) Final snapshot after 2.0 ns of MD simulation of a POPG monolayer at 60 Å2/lipid. Water molecules and chloride ions are shown in cyan and purple, respectively. (b) Atomic density profiles of POPG monolayer systems as a function of Δz, where the air/liquid interface is 0 (negative values are toward the water layer, and positive values are toward the lipid). The lipid surface densities are 55, 60, 65, and 70 Å2/lipid. Red solid lines denote that of unsaturated carbons of lipid acyl chains, black dashed lines denote that of saturated carbons of lipid acyl chains, and blue dotted lines denote the density profiles of oxygen atoms of water molecules.

