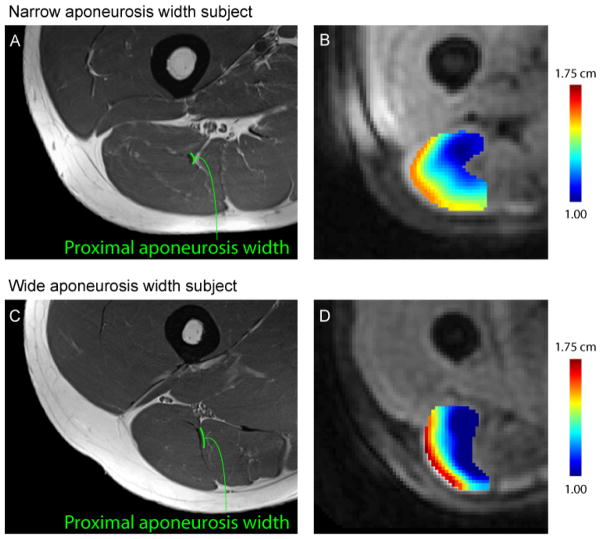
Figure 5. Example high-resolution images and displacement color maps.
Example high-resolution image and aponeurosis width measurement for a representative subject with a narrow aponeurosis (A) and wide aponeurosis (C) during active lengthening. Color maps of displacement magnitude demonstrate a small region (i.e., area) of localized, low displacement adjacent to the proximal aponeurosis for a narrow width subject (B) relative to a wide aponeurosis width subject (D).

