
Figure 4.
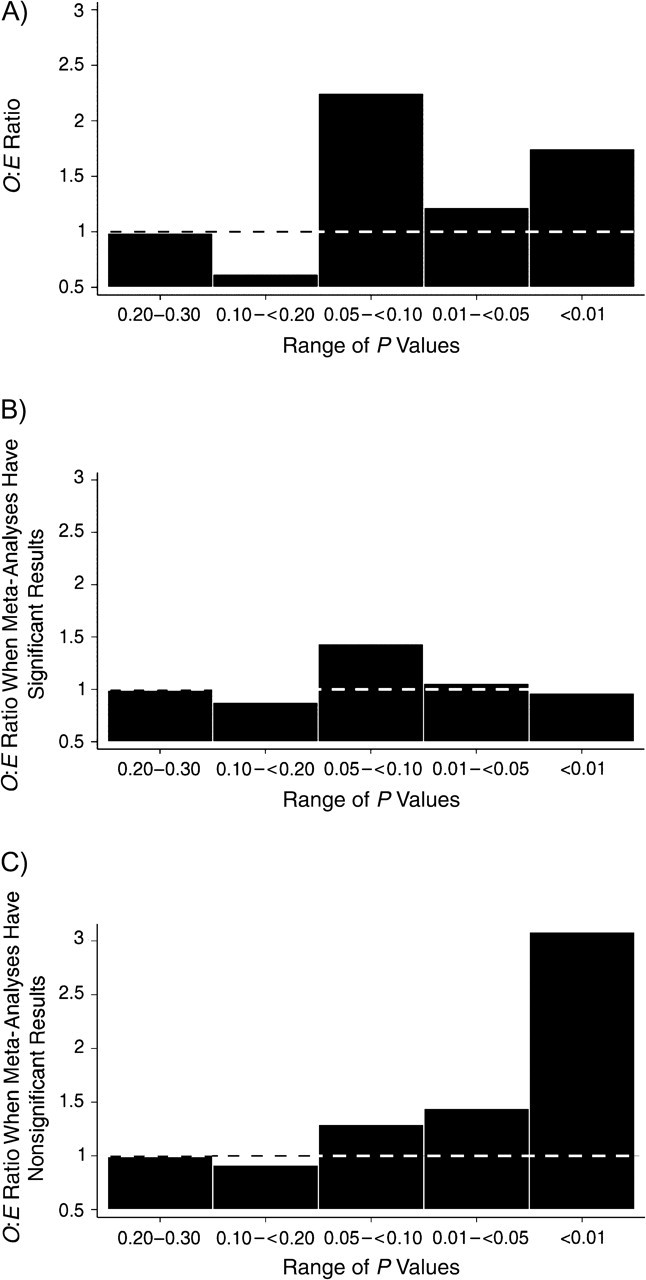
Ratio of observed (O) to expected (E) numbers of studies with results in a specific range of P values. A) All meta-analyses; B) meta-analyses with significant results; C) meta-analyses with nonsignificant results. Dotted lines correspond to 1, where O and E are equal.