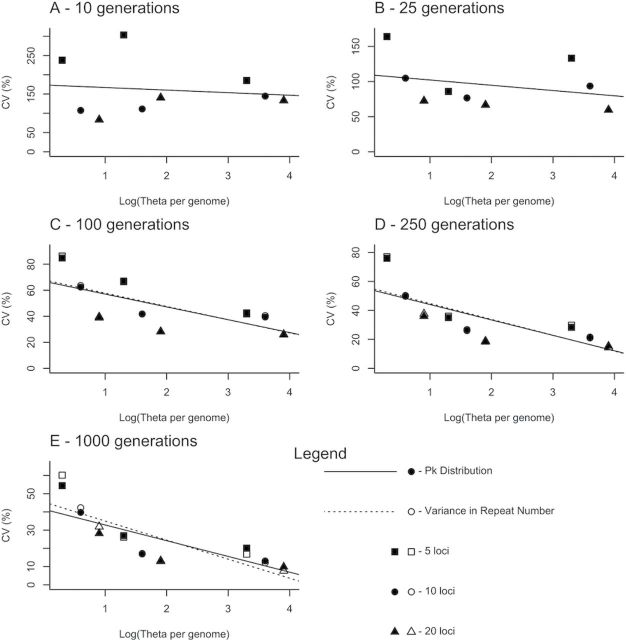
Figure 2.
Precision of the age estimation methods employed in this study. CVs are plotted against the log of genome-wide θ, defined here as the sum of the locus-specific θ values (θ i = 4N e µ i). Separate plots are provided for each of the five simulated ages. Within each plot, parameter combinations sampling 5, 10, and 20 loci are indicated with squares, circles, and triangles, respectively. The relationship between CV and the informational content of the dataset [log(genome-wide θ)] is shown for each method. This relationship was assessed using a generalized linear model and trend lines for each individual method are plotted.

