
Fig. 4.
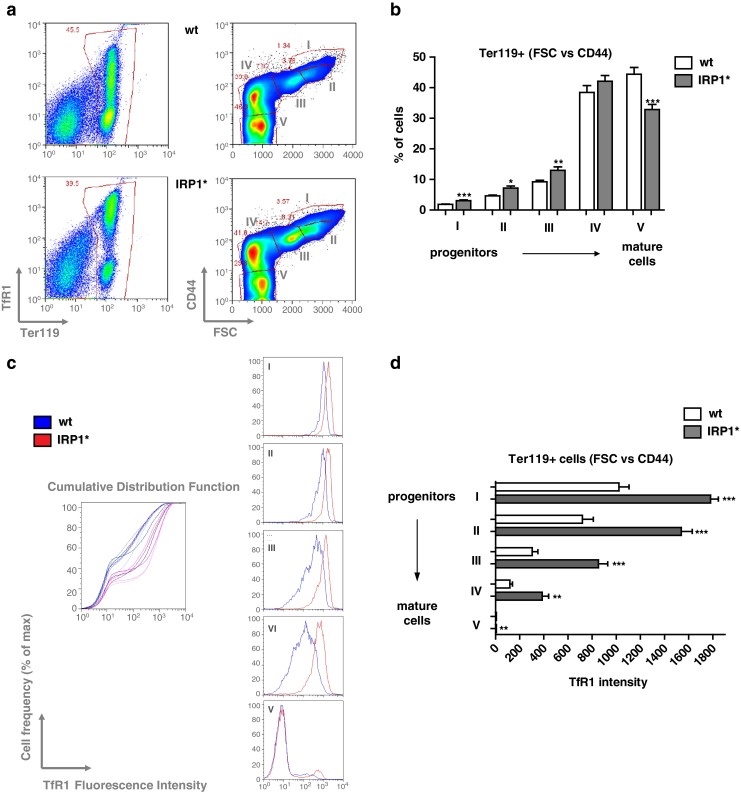
Gain of IRP1 function impairs normal erythropoiesis. a Representative FACS profiles of bone marrow-derived erythroid progenitor cells co-stained with Ter-119, CD71, and CD44. For each genotype, the panels on the left side show the classical Ter119/CD71 profiles allowing for separation of immature (Ter119+, CD71 high) and more mature (Ter119+, CD71 low) cells. The right panels represent CD44 vs. FSC (forward scatter) on the erythroid gate established in the Ter119/CD71 profile. Populations I, II, III, IV, and V represent distinct and progressively more mature erythroid populations [22]. Upper panels correspond to wild type sample, the lower ones to IRP1*. b Relative quantification of the frequencies of each erythroid population. c Histogram representing the cumulative cell frequency distribution as a function of TfR1 intensity of erythroblasts (left panel). Histograms showing the peaks of cell frequency distribution as a function of TfR1 intensity in the distinct five subpopulations of erythroid progenitors (right panels). d Relative quantification of TfR1 intensity in each erythroid subpopulation. Six homozygous females per each genotype were analyzed. *p<0.05; **p<0.01; ***p<0.001