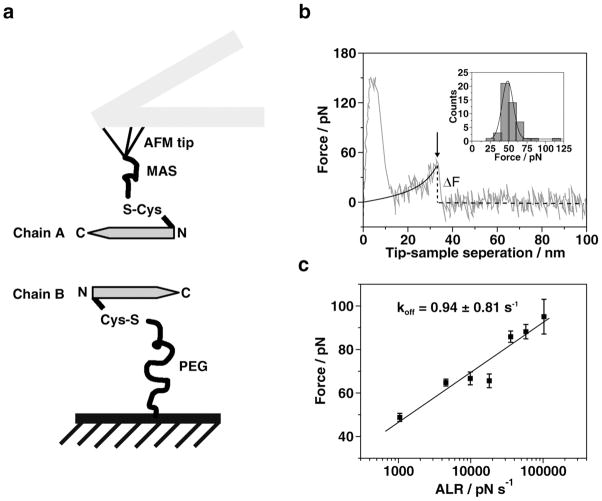
Figure 2.
Single molecular force spectroscopy. (a) Schematics of the experimental setup. The peptide was immobilized on AFM tips and mica surfaces through N-terminal cysteine. Bifunctional PEG (about 77 PEG repeats, long linker) was used to attach the peptides to mica surface. MAS (5 repeats of PEG, short linker) was utilized to connect peptides to AFM tips. (b) A typical force curve illustrating the rupture event force curves (grey line) recorded at pH 6 with 500 nm/s pulling rate, black line is from the worm-like chain model fitting19; the insert figure shows distribution of rupture force (bar) and fitting results with probability function (line). The mean value of force was 48.62 ± 8.38 pN. (c) The DFS analysis for Aβ (13-23) acquired at pH 2. Forces obtained from different pulling rates are plotted against logarithmic apparent loading rates (ALR). Seven ALR values were used to generate the plot. Each data point is an average of three independent experiments. The data set was approximated by the Bell-Evans model as described in reference 25. The intercept on the x-axis was used for the calculation of the off-rate constant producing the lifetime value of 1.06 ± 0.95 s. The large variance of this value is due to a logarithmic dependence of the off-rate constant value on the experimentally determined intercept value.

