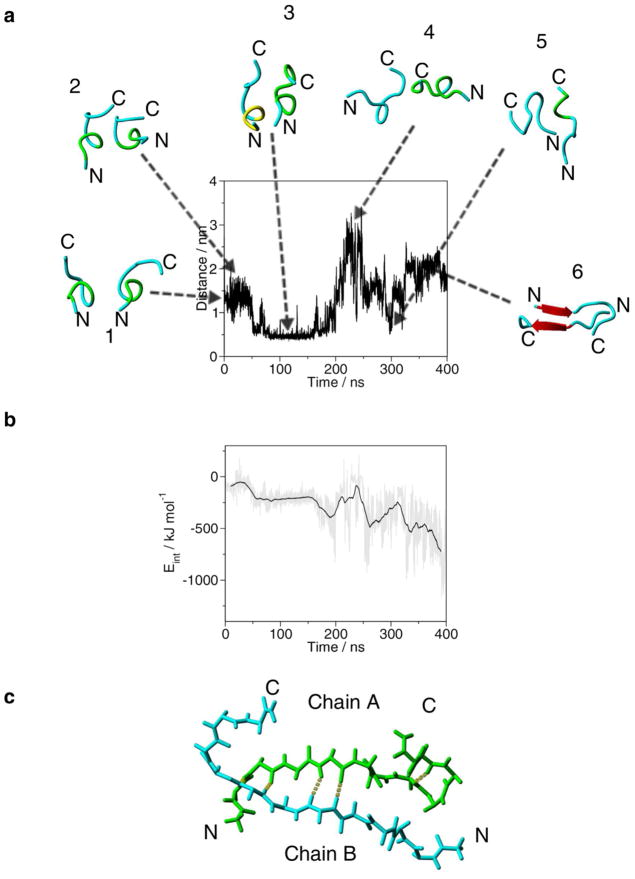
Figure 4.
Evolution of the distance between the center of mass of Cys13 of chain A and the center of mass of Cys13 of chain B in during the 400 ns MD simulation of the dimer structure. Snapshots of the dimer backbone structures from the trajectory are placed inside the plot. (a) 1, 0 ns; 2, 20 ns; 3, 97.9 ns; 4, 221 ns; 5, 300 ns; 6, 359 ns. Backbone conformation of the peptide chain is as follows: cyan is random meander; yellow is 310-helix; green is β-turn/bend, red arrow is β-sheet and H-bonds are yellow dotted lines. N and C indicate the N-and C-termini, respectively. (b) Inter-molecular interactions (Eint) during the 400 ns MD simulation of the dimer structure. The grey line shows Eint at every 10 ps, the black line is the running average at 5 ns intervals. (c) Antiparallel backbone structure of the central structure of the largest cluster of the last 50 ns of the MD simulation. In chain A the backbone carbon atoms are in green. H-bonds are yellow dotted lines. N and C indicate the N-and C-termini, respectively.

