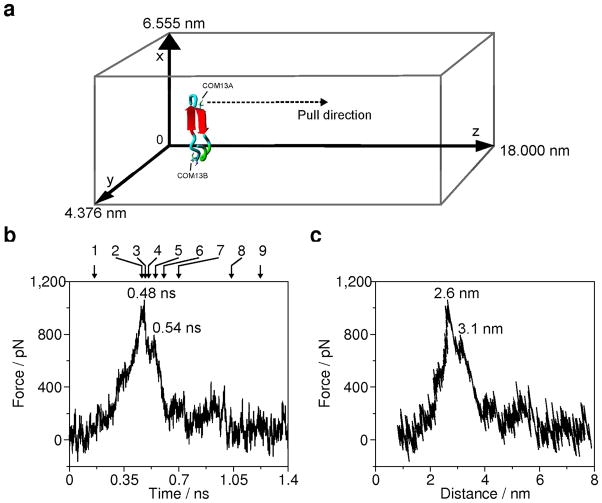
Figure 5.
Force curves acquired at 5 nm/ns pulling rate from SMD simulation. (a) Pulling the center of mass of Cys13 of monomer A (COM13A) along the z-axis. The central structure of the largest cluster of the last 50 ns of the MD simulation of the dimer is in a rectangular box. For clarity the water molecules are not shown. The dimension of the box is 6.555 nm × 4.376 nm × 18 nm. The pulling direction is indicated by a dashed arrow. Backbone conformation of the peptide chain is as follows: cyan is random meander; green is β-turn/bend, red arrow is β-sheet. Numbers inside the force curve panels indicate the time (b) and distance (c) locations of the characteristic peaks. Arrows and numbers on panel b indicate the snapshots in figure 6.

