Figure 6.
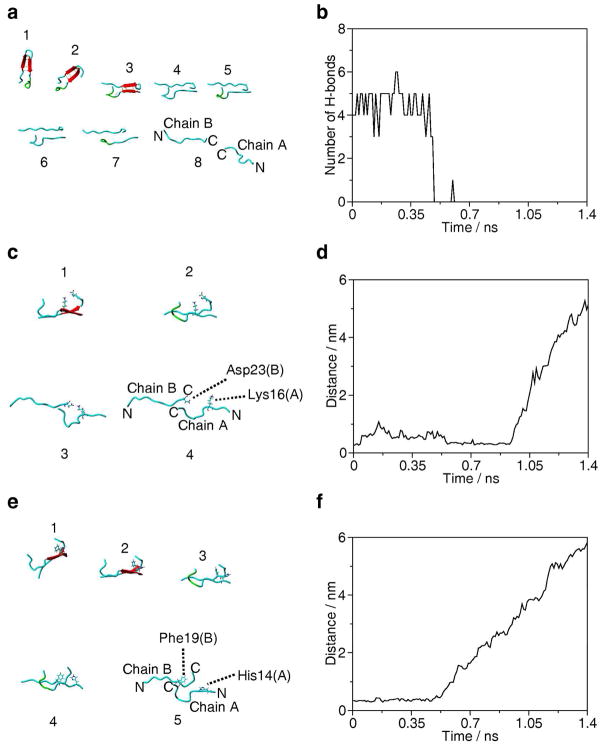
Force-induced dissociation pathway of the dimer structure during SMD simulation (5 nm/ns pulling rate). The snapshots of dimer structure are from 1, 0.2 ns; 2, 0.48 ns; 3, 0.49 ns; 4, 0.5 ns; 5, 0.54 ns; 6, 0.6 ns; 7, 0.7 ns; 8, 0.9 ns and 9, 1.2 ns of the SMD trajectory. The numbers correspond to the position numbers shown in Figure 5b. (a) H-bond breaking. Red arrow indicates β–sheet structure and H-bonds are yellow dotted lines. N and C indicate the N- and C-terminal ends, respectively. (b) Changes in the number of inter-chain H-bonds. (c) Force induced dissociation of the inter-chain salt bridge between Lys16 of chain A and Asp23 of chain B. (d) Distance between the center-of-masses of εNH3+ of Lys16 of chain A and βCOO- of Asp23 of chain B groups. (e) Weakly polar interaction between side chain of Phe19 of chain B and side chain of His14 of chain A. (f) Distance between the CβH group of His14 of chain A and the center of the phenyl ring of Phe19 of chain B.

