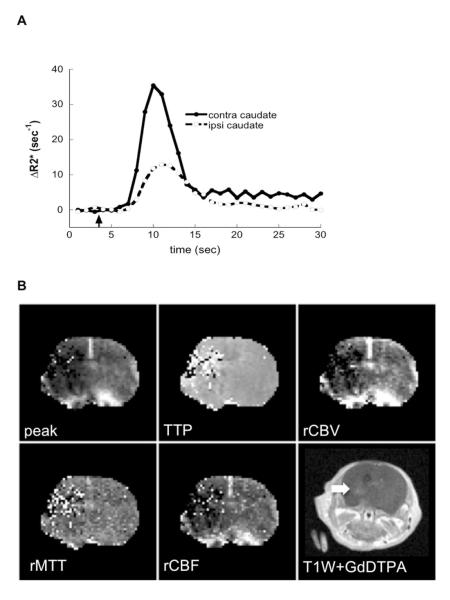
Figure 2.
Disturbances of cerebral microcirculation and blood-brain barrier permeabity 3 days after middle cerebral arterial occlusion. (A) ΔR2* time curves obtained before, during, and after a bolus of gadolinium-diethylenetriamine pentaacetic acid from the entire injured region of the ipsilateral hemisphere and a similar region in the contralateral hemisphere. (B) Representative images of ΔR2* (peak), time of contrast arrival relative cerebral blood volume transit time, and relative cerebral blood flow obtained in the same animal. (C) T1-weighted spin-echo images obtained 15 minutes after administration of 0.3 mmol/kg gadolinium-diethylenetriamine pentaacetic acid at the same slice locations as used for bolus response profiles. Two out of 3 pups exhibited contrast enhancement (arrows).

