Figure 1.
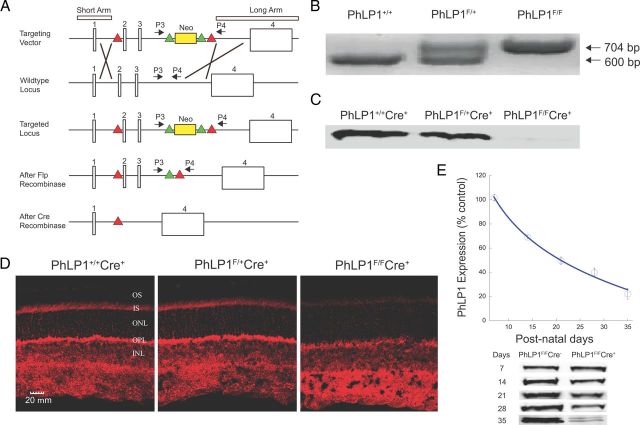
Generation and characterization of the rod photoreceptor-specific PhLP1 knock-out mouse. A, The scheme for constructing the floxed Phlp1 gene is shown. Sketch 1 shows the targeting vector with the short and long homology arm regions, the neomycin selection cassette flanked by frt recombination sites (green triangles) placed in intron 3 and the loxP recombination sites in introns 1 and 3 (red triangles). Crossover lines indicate the regions of homologous recombination. Sketch 2 shows the structure of the wild-type Phlp1 locus. Sketch 3 shows the targeted Phlp1 locus after recombination. Sketch 4 shows the floxed Phlp1 gene after removal of the neomycin cassette by FLP recombination. Sketch 5 shows the disrupted gene after Cre recombination. P3 and P4 represent the forward and reverse primer sites used for genotyping the flox-Phlp1 mice. B, PCR genotyping results using the P3 and P4 primers. The flox-Phlp1 gene produced a 704 bp product, while the wild-type phlp1 gene produced a 600 bp product. C, Immunoblot detection of PhLP1 in rod outer segment preparations from 1-month-old PhLP1+/+Cre+, PhLP1F/+Cre+, and PhLP1F/FCre+ mice. D, Immunolocalization of PhLP1 in retinal cross-sections from 1-month-old PhLP1+/+Cre+, PhLP1F/+Cre+, and PhLP1F/FCre+ mice. E, Time course of Cre-mediated loss of PhLP1 expression. Retinal extracts from PhLP1F/FCre+ and PhLP1F/FCre− mice were immunoblotted for PhLP1 at the indicated postnatal days. The PhLP1 bands were quantified and normalized relative to the PhLP1F/FCre− control. Symbols represent the average ± SEM from three mice of each genotype. Representative immunoblots are shown below the graph.

