Figure 7.

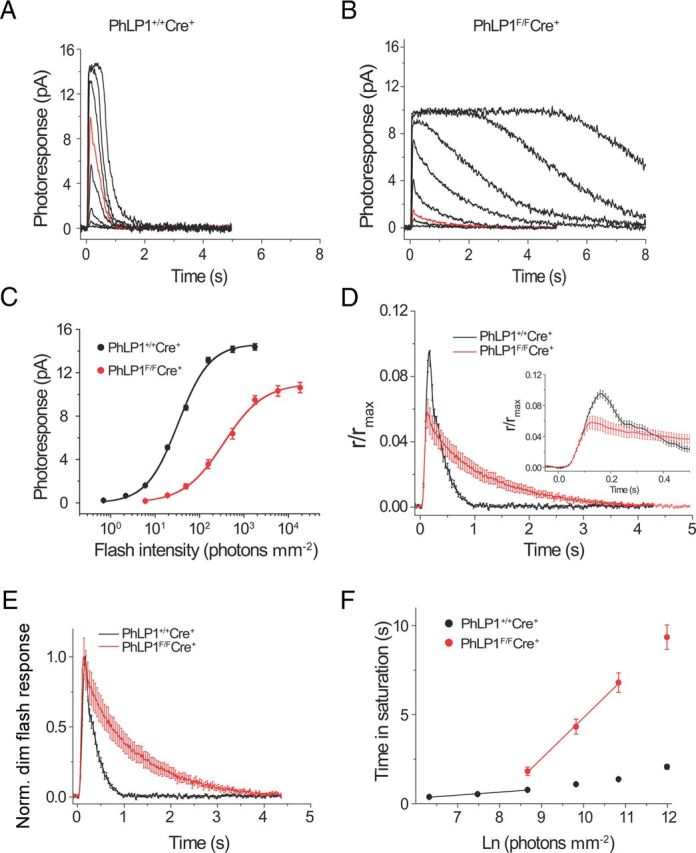
Single-cell photoresponses of PhLP1-deficient rods. A, B, Representative families of flash responses from 1-month-old PhLP1+/+Cre+ (A) and PhLP1F/FCre+ (B) mice are shown. Test flashes of 500 nm light with intensities of 0.7, 2.2, 6.0, 19.0, 49.5, 157, 557, and 1764 photons μm−2 (for control rods) or 6.0, 19.0, 49.5, 157, 557, 1764, 5811, and 18415 photons μm−2 (for PhLP1F/FCre+ rods) were delivered at time 0. The red traces show responses to an identical light intensity (49.5 photons μm−2). C, Intensity–response functions for rods from PhLP1+/+Cre+ (n = 22) and PhLP1F/FCre+ (n = 23) mice. Symbols represent the average ± SEM. Data were fit with a hyperbolic Naka–Rushton function and fit parameters are shown in Table 2. D, Amplification of the phototransduction cascade in mouse rods. Population-averaged dim flash responses to light intensities of 49.5 photons μm−2 for PhLP1F/FCre+ rods and 6.0 photons μm−2 for wild-type rods were normalized to their corresponding maximum dark currents, rmax. Then the PhLP1F/FCre+ fractional response was scaled down by the factor of 2.2 to make its initial rising phase coincide with that of wild-type response. The light intensity corresponding to this scaled PhLP1F/FCre+ response was thus determined as 49.5/2.2 = 22.5 photons μm−2. The inset shows the rising phase of the responses on an extended time scale. E, Kinetics of the dim flash responses. Normalized population-averaged dim flash responses to light intensities of 6.0 photons μm−2 for PhLP1+/+Cre+ (n = 22) and 49.5 photons μm−2 for PhLP1F/FCre+ (n = 23), demonstrating the decelerated photoresponse inactivation in PhLP1-deficient rods. F, Determination of the dominant time constant of recovery (τD) from a series of supersaturating flashes. Linear fits throughout the data yielded τD values indicated in Table 2. Values are means ± SEM.
