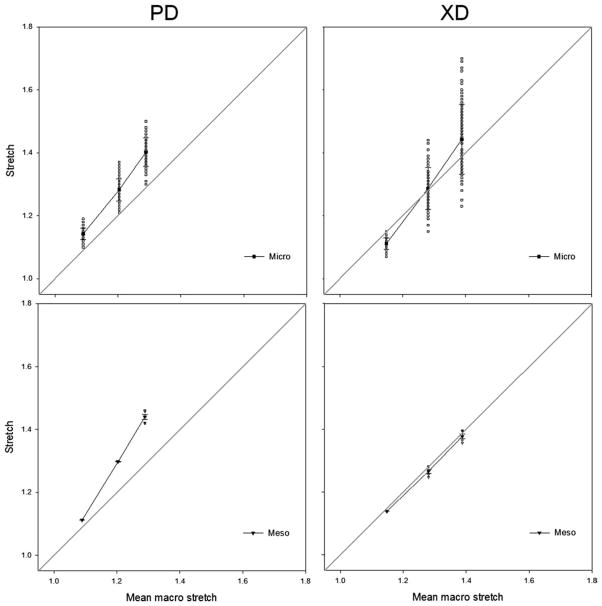
Figure 5.
Observed multiscale deformation behavior. Presented are the mean and standard error (meso) or standard deviation (micro) values as a function of mean macroscale deformation for comparison. Raw values (open symbols) are also plotted to depict the true span of the observed deformation. When electrospun PEUU scaffolds are deformed, some discrepancies do arise between the defined scales as seen by data which diverges from unity (gray line). This is attributed to the complex, spatially variant structure which results from the electrospinning process at the microscale. As the characteristic length is increased, the measured deformation field becomes increasingly homogeneous such that a reasonably uniform response is observed at the macroscale (1–3 mm).

