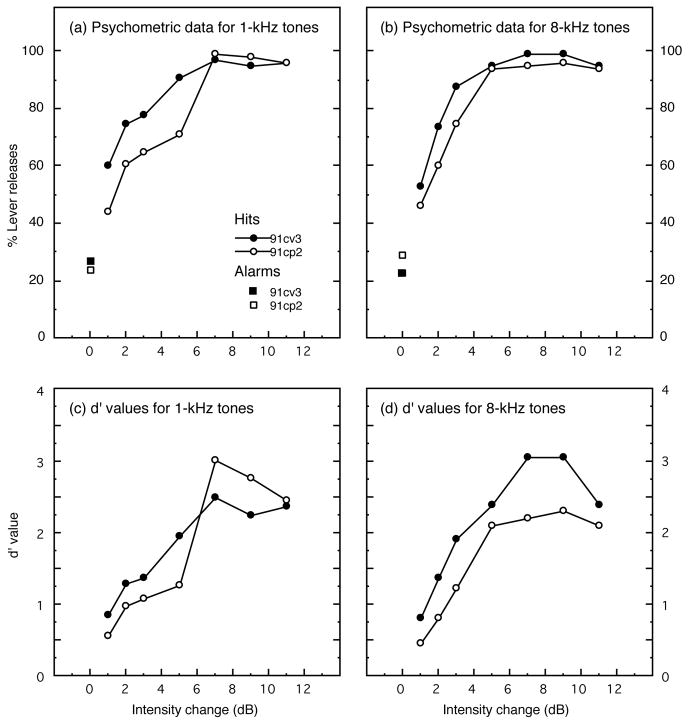
FIGURE 8. Pre-lesion psychometric functions for intensity discrimination of pure tones at (a) 1 kHz and (b) 8 kHz.
Signal detection methods were used to derive d′ values from the percentage of hits at each intensity change and overall false-alarm rates, which are plotted at the 0-dB intensity change (squares). The resulting d′ values are shown in (c) for tests with 1-kHz tones and in (d) for tests with 8-kHz tones.

