Figure 1.
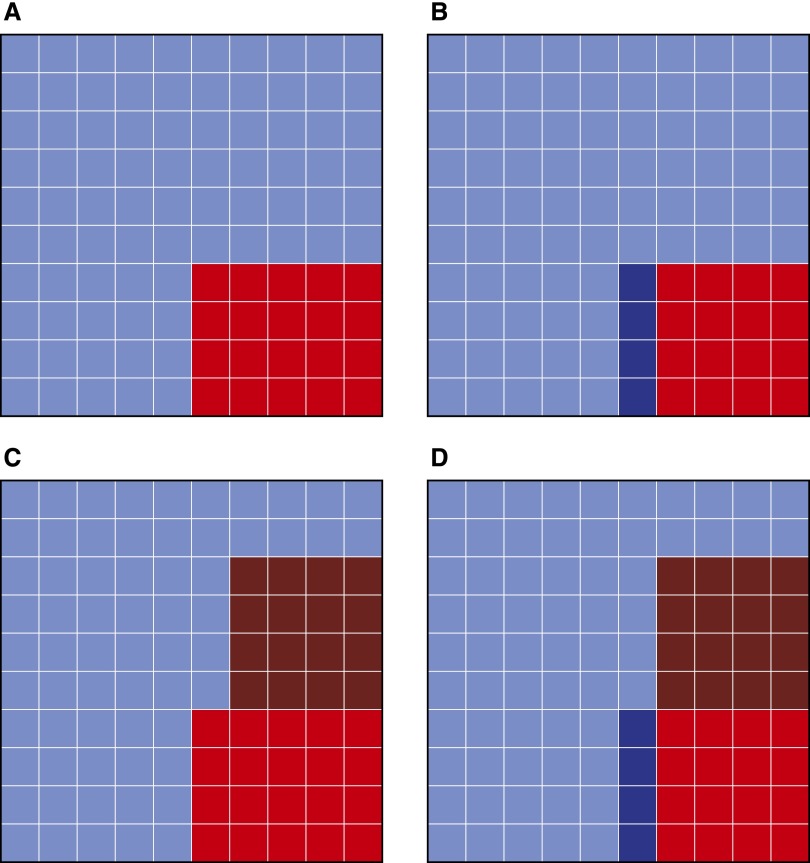
Apparent diagnostic performance characteristics of a perfect biomarker compared with an imperfect gold standard. (A) Actual disease prevalence = 20%. Red squares represent true disease positives. Blue squares represent true disease negatives. (B) Imperfect gold standard sensitivity = 80%. Of the 20 true disease positives, 4 are classified as disease negative by the imperfect gold standard (darker blue). (C) Imperfect gold standard specificity = 80%. Of the 80 true disease negatives, 16 are classified as disease positive by the imperfect gold standard (darker red). (D) The imperfect gold standard has classified 32 individuals as disease positive (red) and 68 individuals as disease negative (blue). A perfect biomarker will correctly identify only 16 of the original true positives (lighter red) and fail to identify the 16 false positives (darker red), leading to an apparent sensitivity of 16/32 = 50%. A perfect biomarker will identify as disease negative only 64 of the original true negatives (lighter blue) and fail to identify the 4 false negatives (darker blue), leading to an apparent specificity of 64/68 = 94%.

