
Figure 2.
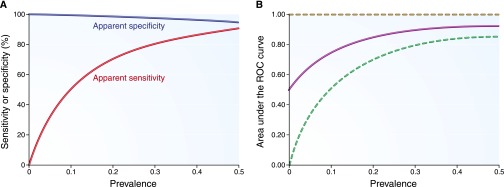
Apparent diagnostic performance characteristics of a perfect biomarker when an imperfect gold standard has 80% sensitivity and 90% specificity. (A) The apparent sensitivity and specificity. (B) The apparent AUC-ROC curve (solid line, under the assumption of conditional independence) with lower and upper bounds (dotted lines). Results are plotted for a range of true disease prevalence estimates.