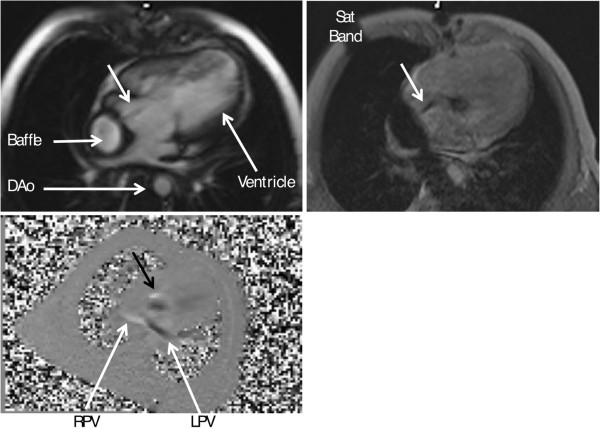
Figure 7.
Flow imaging in congenital heart disease. Visualizing flow across a fenestration in a single ventricle after Fontan. Upper left is the magnitude image, upper right is the gradient echo image with a saturation band and lower left image is an inplane velocity map in the 3-chamber view demonstrating the fenestration flow (black arrow). Note opposite directions of the flow on the inplane velocity map in right (RPV, white flow) and left pulmonary veins (LPV, black flow). DAo - descending aorta.

