
Figure 8.
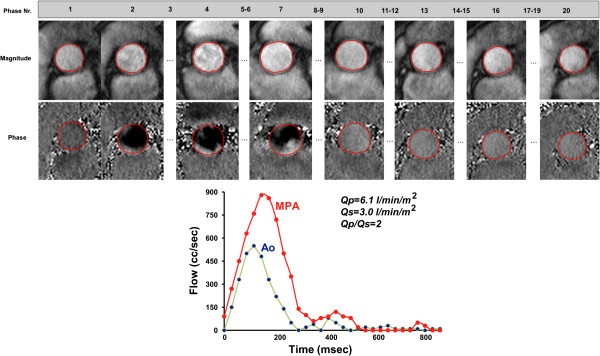
Quantification of blood flow. (top) Contours were drawn delineating the aortic lumen at the sinotubular level during all 20 phases of the cardiac cycle to assess aortic flow. (bottom) Flow curves from measurements in the ascending aorta and in the pulmonary artery in a patient with ventricular septal defect showing a left-to-right shunt.