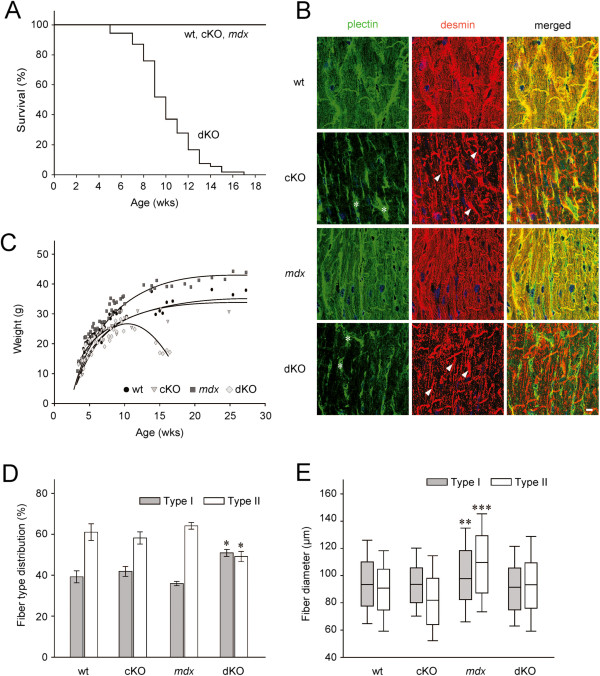
Figure 1.
Phenotypic analyses of dKO mice compared to wt, cKO, and mdx mice. (A) Lifespan (n = 54 per genotype). (B) Immunofluorescence microscopy of heart cryosections. Note aggregates of desmin (arrows) and plectin-positive connective tissue (asterisks) in cKO and dKO samples. Bar, 10 μm. (C) Body weight. Note reduced weight of dKO mice compared to wt and cKO littermates, and increased weight of mdx mice (n ≥ 55 per genotype). (D) Fiber type distribution in soleus muscle determined by ATPase staining (pH 4.2). Values represent percent mean ± SEM of total fibers (n ≥ 3 per genotype; *P < 0.05). (E) Diameters of type I and II fibers. Median (line in box), 25th (bottom line of box), 75th (top line of box), 5th and 95th (whiskers) percentiles are indicated (n ≥ 3 per genotype; **P < 0.01, ***P < 0.001).

