Figure 7.
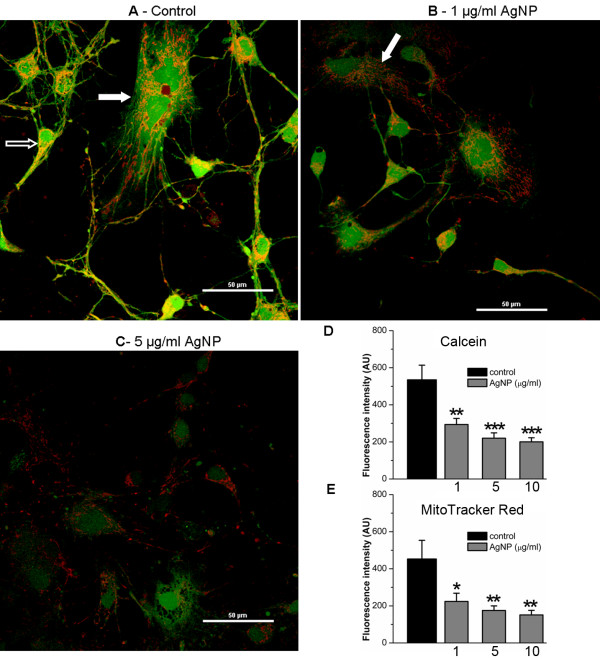
Cell viability and mitochondria staining of rat cortical cultures under control and AgNP-treated conditions. Cells were first cultured for 4 days and subsequently exposed to AgNPs at 1, 5, and 10 μg/ml for another 2 days. On day 6, MitoTracker Red, a selective mitochondria marker and calcein AM, an indicator of cell viability, were loaded in control and AgNP-treated cultures. Representative images show that cells maintained in control culture medium (A) displayed intense green fluorescence staining of healthy structures of all cell types including neurons (indicated by open arrows) and glial cells (indicated by solid arrows). These cells also contain intense and well-organized labeling of mitochondrial structures by the red fluorescent MitoTracker Red dye. Co-localized spots (yellow) likely represent the location of intact and functional mitochondria. However, AgNP-treated cells (B and C) drastically lost the green fluorescence intensity and a degree of yellow staining indicating that AgNPs induced decrease of cell viability is accompanied by mitochondrial dysfunction. Statistical analysis shows that the fluorescent intensity of both calcein (D) and MitoTracker Red (E) was reduced significantly by AgNPs. Statistical significance was determined using ANOVA one-way analysis of variance. Post hoc analysis was conducted using Tukey’s test. * P < 0.05. ** P < 0.01. *** P < 0.001. Error bars indicate SEM.

