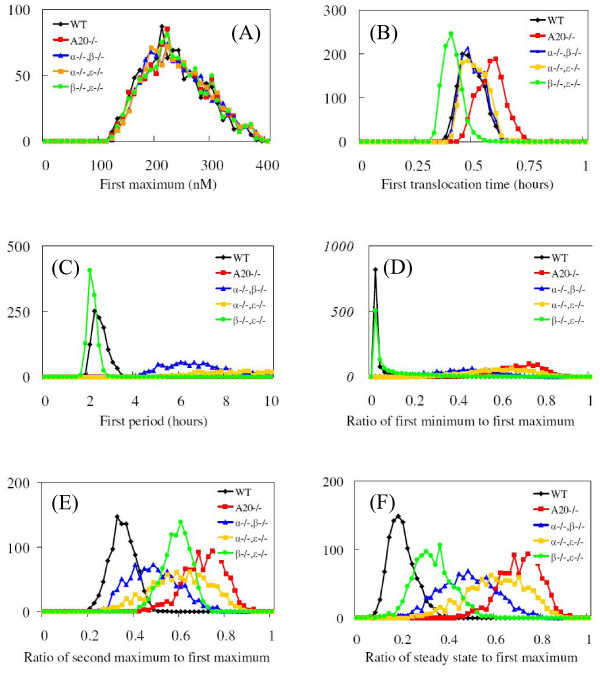
Figure 8.
Distributions of six dynamic features of nuclear NF-кB profiles, for an ensemble of 1,000 replicates of the wild type (black lines), A20 knocked-out mutant (red lines), IкBα and IкBβ genes double knocked-out mutant (blue lines), IкBα and IкBϵ genes double knocked-out mutant (yellow lines), and IкBβ and IкBϵ genes double knocked-out mutants (green lines). The six dynamic features are First Maximum (the amplitude of the first peak) in panel (A), First Translocation Time (the timing of the first peak) in panel (B), First Period (the time between the first and the second peaks) in panel (C), Ratio of First Minimum to First Maximum (ratio of the first minimum value to the first maximum value) in panel (D), Ratio of Second Maximum to First Maximum (ratio of the second peak amplitude to the first maximum value) in panel (E), and Ratio of Steady State to First Maximum (ratio of the steady state level to the first maximum value) in panel (F).

