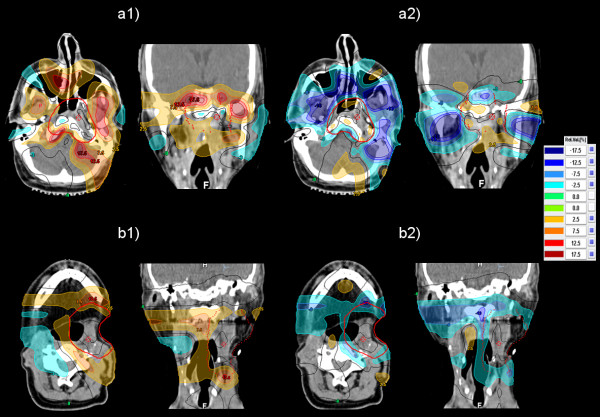
Figure 2.
Dose difference plots. Distribution of the dose difference obtained by subtracting the dose distribution of the IMPT2mm-plan from the dose distributions of the IMPT0mm- and the IMPT5mm-plans. (a1) Dose difference IMPT0mm-IMPT2mm for patient 1. (a2) Dose difference IMPT5mm-IMPT2mm for patient 1. The corresponding dose difference plots for patient 7 are shown in (b1) and (b2), respectively.

