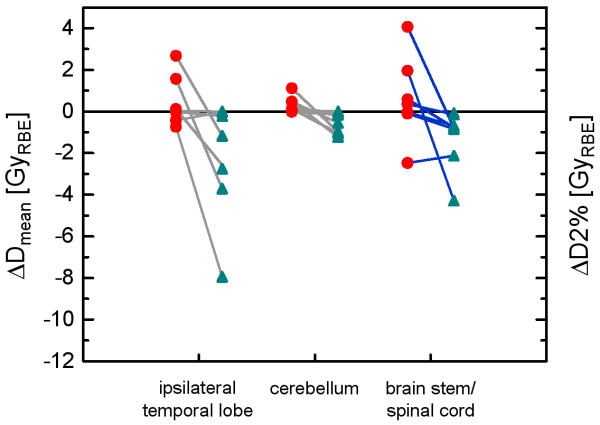
Figure 3.
Normal tissue exposure. Mean dose difference to the ipsilateral temporal lobe and the cerebellum between the IMPT0mm- and IMPT2mm-plans (red circles) and between the IMPT5mm- and IMPT2mm-plans (green triangles) for the 7 patients (left vertical axis). The respective differences in D2%, quantifying hot spots in the serial organ of each patient exposed to the highest doses, i.e. the either brain stem or the spinal cord, are also shown (right vertical axis).

