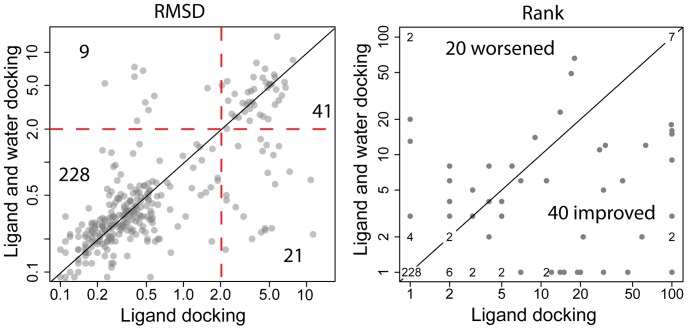
Figure 4. RMSD and rank comparisons between standard and ligand-centric loose water docking of HIV-1 PR/PI.
Left panel: RMSD of top scoring Rosetta model. 159 models fall below the diagonal (improved RMSDs) while 129 are above it. Red dashed lines represent the 2 Å RMSD metric for successful docking. Predictions in the lower-right quadrant turn from failures to successes up on water docking. Upper-left quadrant contains predictions that succeeded without water docking and fail with water docking. Right panel: rank of the lowest scoring Rosetta model with RMSD under 2 Å. Where multiple CSAR docking predictions achieved the same rank with and without water docking, these points are replaced with text indicating the number of overlapping points.

