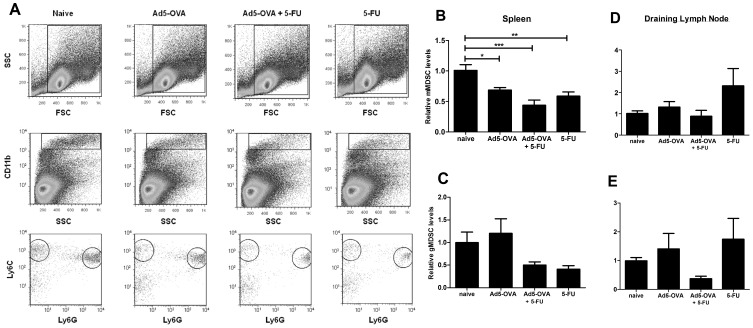
Figure 4. Levels of gMDSCs and mMDSCs in the spleen and draining lymph node.
C57BL/6 mice were challenged with E.G7 cells and then, 7 days post tumor challenge, were treated as indicated and then 5 days later, spleen and draining lymph nodes were harvested and stained using direct immunofluorescence for detection mMDSCs and gMDSCs and then analyzed using flow cytometry (see materials and methods for further details). A. Example of FloJo-generated dot-plots showing how mMDSCs and gMDSCs were delineated in samples obtained from the spleen. Total splenocytes were gated using a forward scatter (FSC) versus side scatter (SSC) dot-plot (top row). These cells were further gated to select for CD11b+hi cells using a SSC versus CD11b dot-plot (middle row). Then these CD11b+hi cells were further defined using a Ly6G versus Ly6C dot-plot (bottom row). mMDSCs were defined as CD11b+Ly6G−Ly6C+hi (circled (left side)) and gMDSCs were defined as CD11b+Ly6G+Ly6C+low (circled (right side)). A similar method of analysis was used for cells obtained from the draining lymph node. B–E. On day 5 post treatment, the levels of mMDSCs (B and D) and gMDSCs (C and E), as a percentage of total cells, were determined, in both the spleen (B and C) and the draining lymph node (D and E). Mean percentage values (and range) for the naïve groups prior to normalization were as follows: mMDSCs in the lymph node = 0.24% (range: 0.02–0.84%); mMDSCs in the spleen = 0.26% (range: 0.02–0.63%); gMDSCs in the lymph node = 0.03% (range: 0.01–0.08%); gMDSCs in the spleen = 1.35% (0.87–4.1%). Results displayed are derived from pooled data from four separate experiments, where the number of mice/treatment group in each experiment was n = 1, n = 2, n = 2, n = 4 and therefore a total of n = 9 mice from each pooled treatment group were analyzed. Statistical significance was determined using an ANOVA one way analysis of variance (with Tukey post-test) (*P<0.05, **P<0.01, ***P<0.001)). Error bars represent standard error of the mean.

