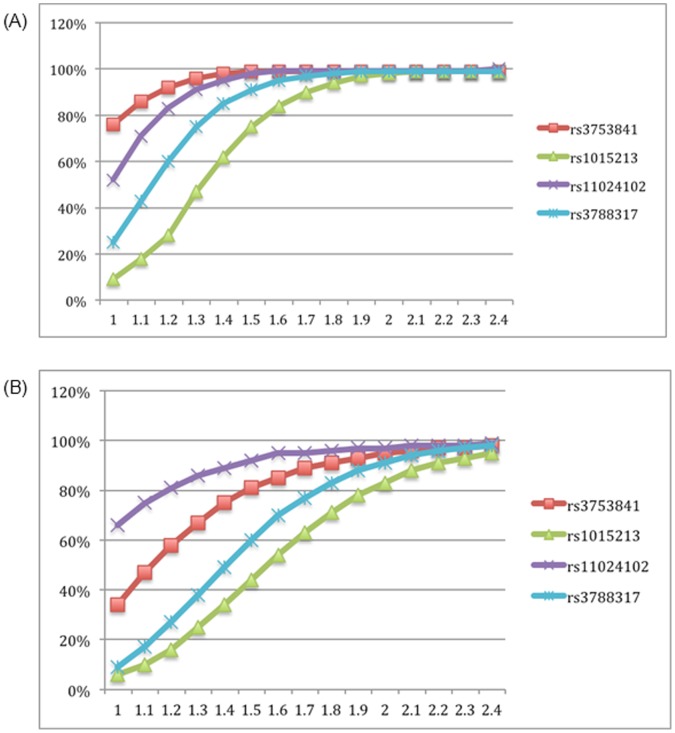
Figure 1. Plot showing the study power of the selected SNPs in both (A) Australian (n = 232 cases and n = 288 controls) and (B) Nepalese (n = 106 cases and 204 controls) populations per-allele odds ratio.
X-axis represents relative risk (range from 1.0 to 2.4) and Y-axis the power in percentage. Minor allele frequencies of each SNP are presented in Table 1.

