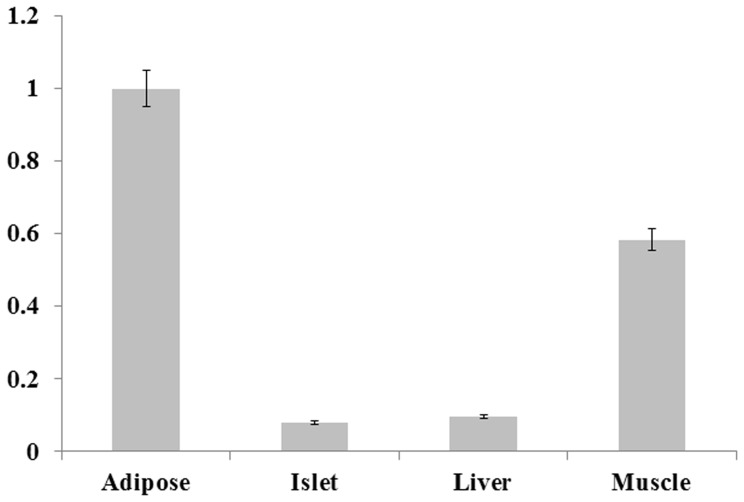
Figure 1. The expression profile of human SPARC.
The expression patterns of SPARC mRNA in human adipose, pancreatic islet, liver and muscle tissues are given relative to the TBP, GUSB and B2M endogenous control genes. Expression level of SPARC in each tissue is expressed relative to SPARC levels in adipose tissue. Error bars are derived from the interquartile range of quantification.

