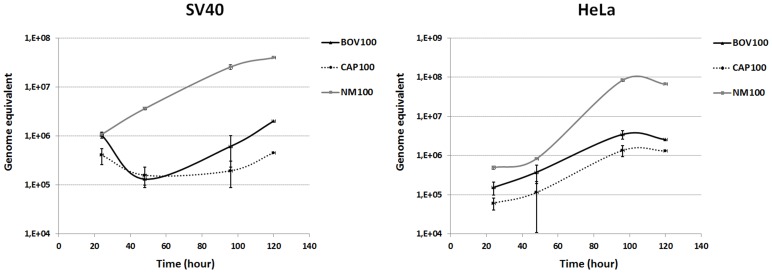
Figure 3. Growth curves of NMI, CbBEB1 and CbBEC1 in HeLa and SV40 cells.
Cells were infected at 100 M.O.I. for 24 hours. Infected cells were then washed and grown in gentamicin-containing medium for 96 additional hours. At fixed time-points, deionized water was added and cells lysed by a 30-min incubation at 82°C. C. burnetii loads were quantified by qPCR on 1∶15 dilutions. Each point indicates the average of four independent cultures and its corresponding standard deviation.

