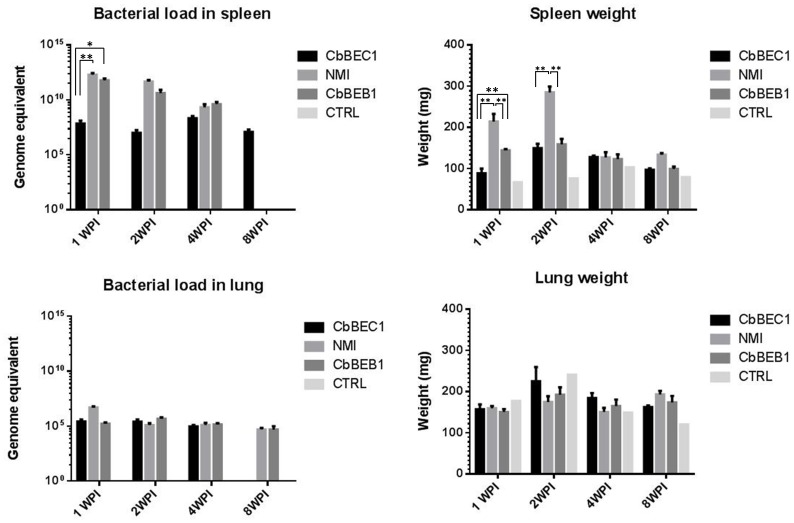
Figure 4. C.burnetti colonization of spleen and lungs as evaluated by qPCR quantification and organ weight.
Graphs show C. burnetii loads in spleen and lungs (left panels) or variations in spleen and lungs weight (right panels). Results are given for uninfected mice and mice infected with NMI, CbBEB1 and CbBEC1 at 1, 2, 4 and 8 weeks post infection. Mean values +/− Standard Error (SE) for 5 mice are shown. * indicates p-values smaller than 0.05 ** indicates p-values smaller than 0.01.

