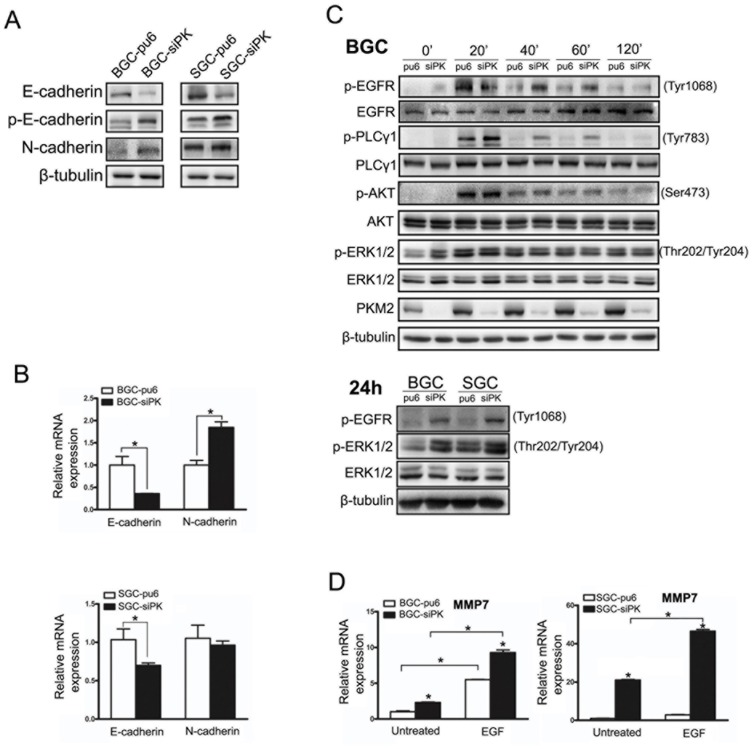
Figure 2. Depletion of PKM2 decreased the expression of E-cadherin and enhanced the activities of the EGF/EGFR downstream signaling pathways.
(A) E-cadherin, phospho-E-cadherin and N-cadherin expression levels were analyzed by immunoblot analysis in BGC823 and SGC7901 stable cells. (B) E-cadherin and N-cadherin expression levels were analyzed by quantitative real-time PCR in BGC823 and SGC7901 stable cells. (C) BGC823 and SGC7901 stable cells were exposed to EGF (100 ng/ml) for different times. The Western blots of cell lysates are shown. The phospho-EGFR (Tyr1068), phospho-PLCγ1 (Tyr783), phospho-AKT (ser473), and phospho-ERK1/2 (Thr202/Tyr204) protein levels are shown as indicated. (D) MMP7 expression levels were analyzed by quantitative real-time PCR in BGC823 and SGC7901 stable cells. Error bars represent the mean ± SD of triplicate experiments (*p<0.05).

