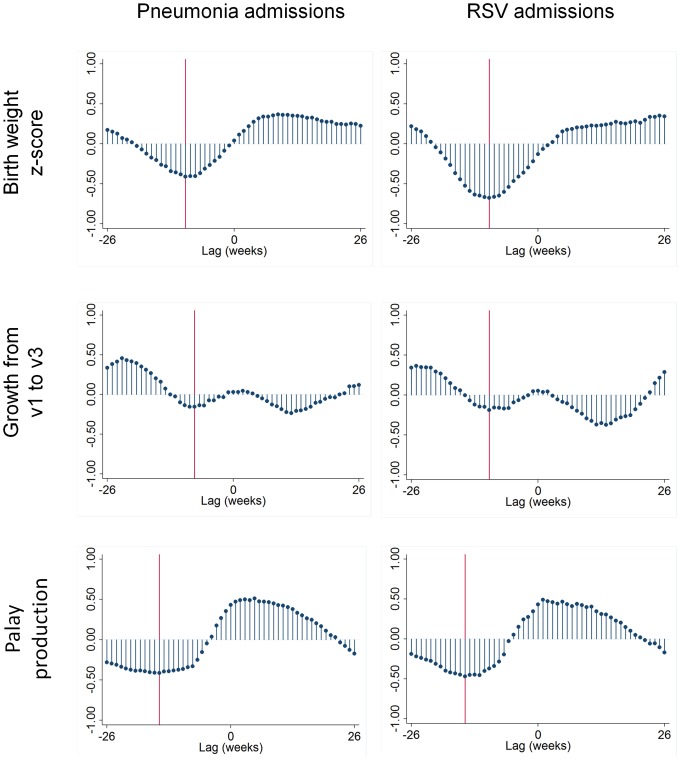
Figure 5. Weekly cross-correlations of seasonal patterns of estimated birth weight z-scores, growth between first and third vaccination, and palay production, with weekly pneumonia and RSV admissions.
A negative lag indicates exposure occurring before the outcome. Vertical reference lines indicate points of maximum correlation. Bohol, Philippines 2000 to 2003.

