
Figure 1. Inter-seasonal variation of mass-independent BMR, MSUM and ME.
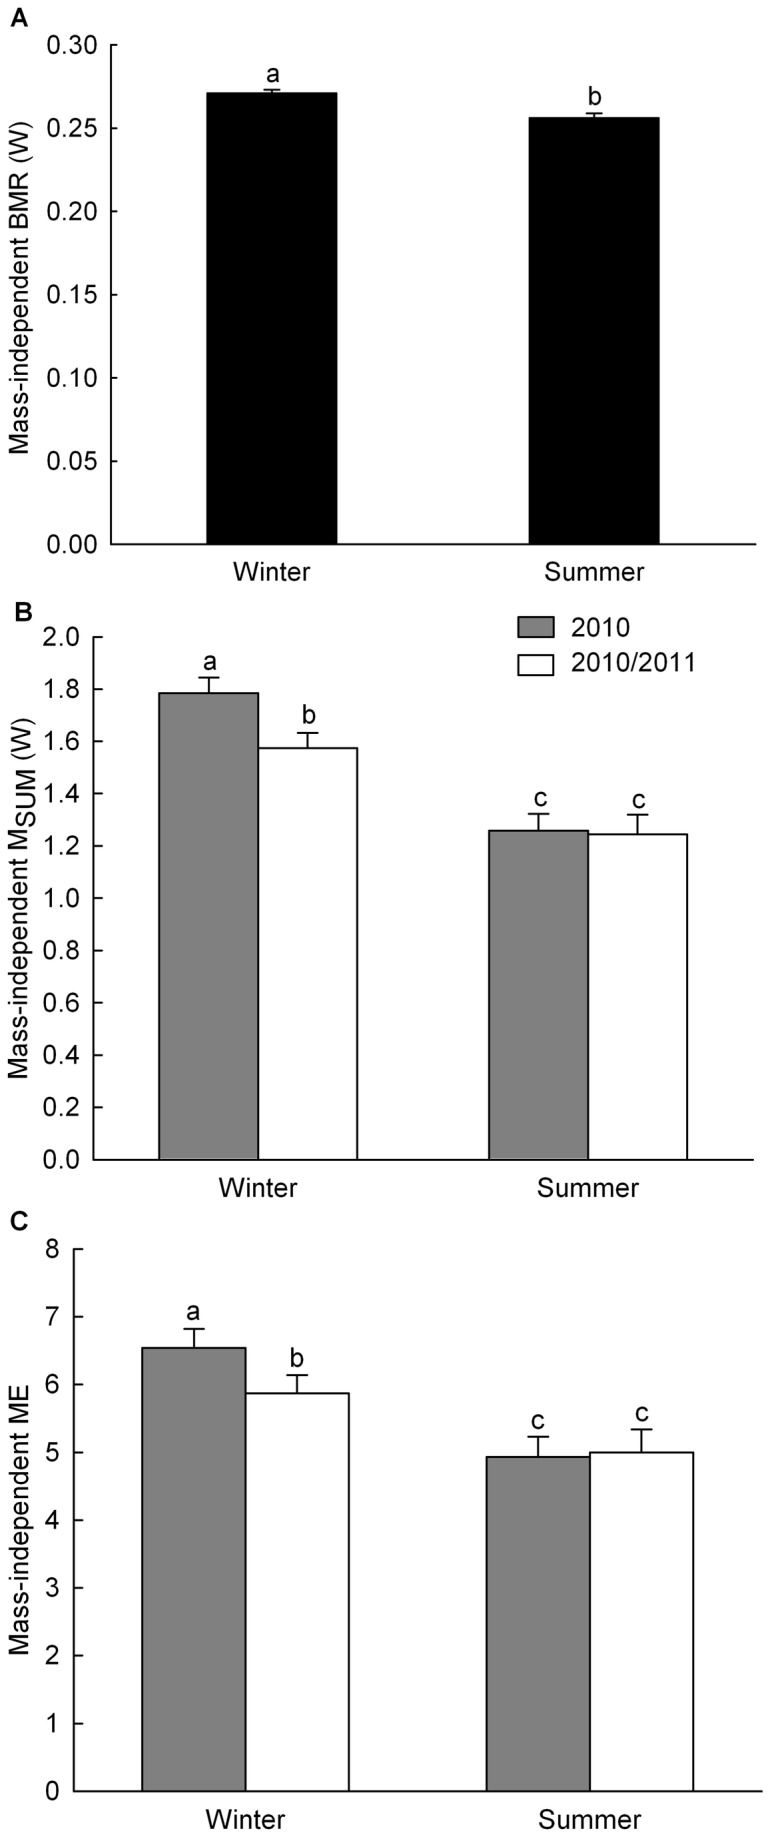
Data are least square means for BMR (A), MSUM (B) and ME (C) controlling for year, season, sex and body mass with bird ID as random parameter. Different letters indicate significant difference between seasons.