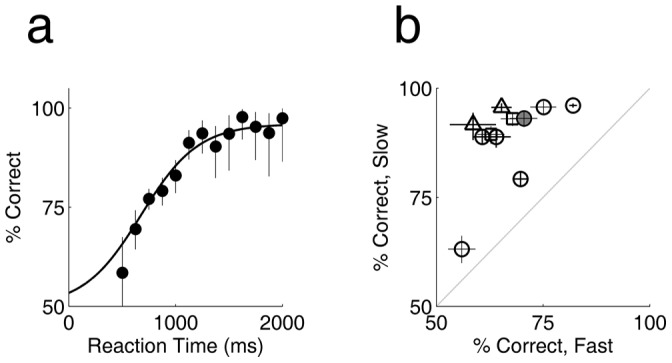
Figure 2. Accuracy increases with reaction time.

a. Accuracy (% correct) as a function of reaction time, from same data as Figure 1 a–b. Error bars indicate binomial confidence intervals. b. Accuracy (% correct) is higher in slow trials than fast trials across the population (11 experiments from 6 rats; symbols defined in Figure 1c). Fast and slow trials are defined as the highest and lowest quartile of each rat’s overall RT distribution within the block respectively. Crosses indicate binomial confidence intervals.
