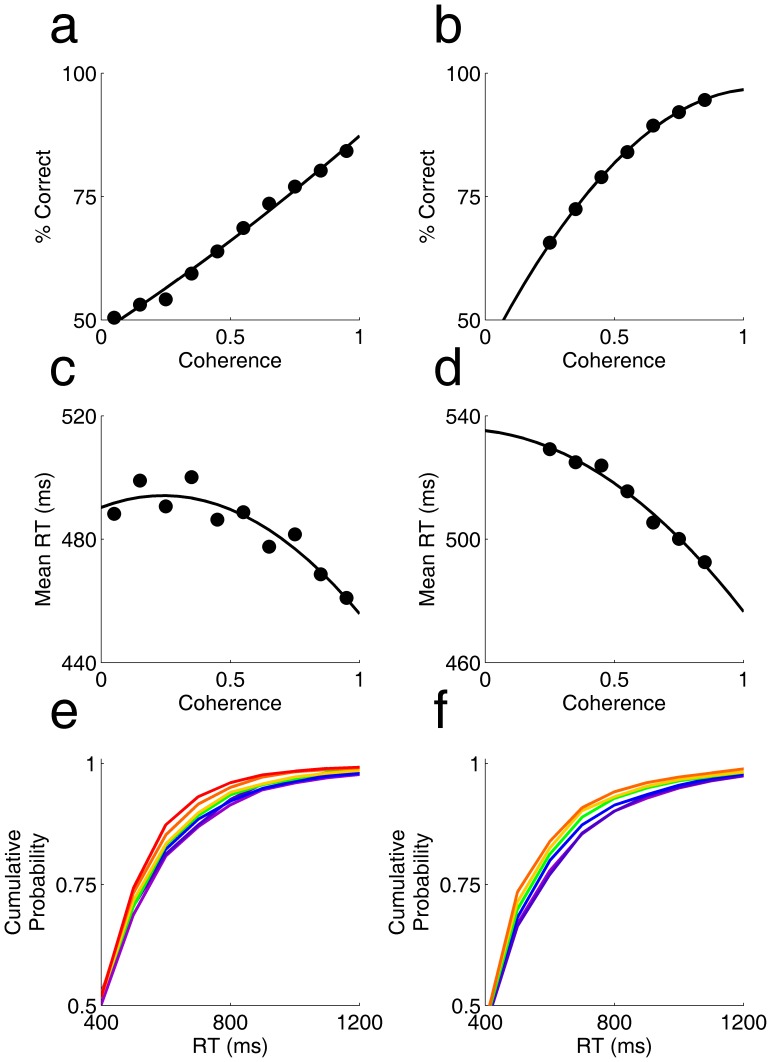
Figure 3. Dependence of accuracy and reaction time on motion strength.
a. Psychometric function – accuracy (% correct) as a function of motion strength (coherence) when coherence was varied from 0–1 in randomly interleaved trials. Symbols indicate data; curve is a 2nd order polynomial fit. b. Psychometric function from another experiment in which coherence was drawn uniformly from the interval 0.2–0.9. c. Chronometric function – mean reaction time as a function of coherence, for the experiment of panel a. d. Chronometric function for the experiment of panel b. e. Cumulative probability of reaction times for different coherence ranges, for experiment of panel a. Color indicates motion coherence from low (cool) to high (hot). Cumulative probability was computed over the range of 0–3 s; axis is expanded to focus on the time range of interest. f. Cumulative probability of reaction times for experiment of panel b. Color scale same as in panel e.

