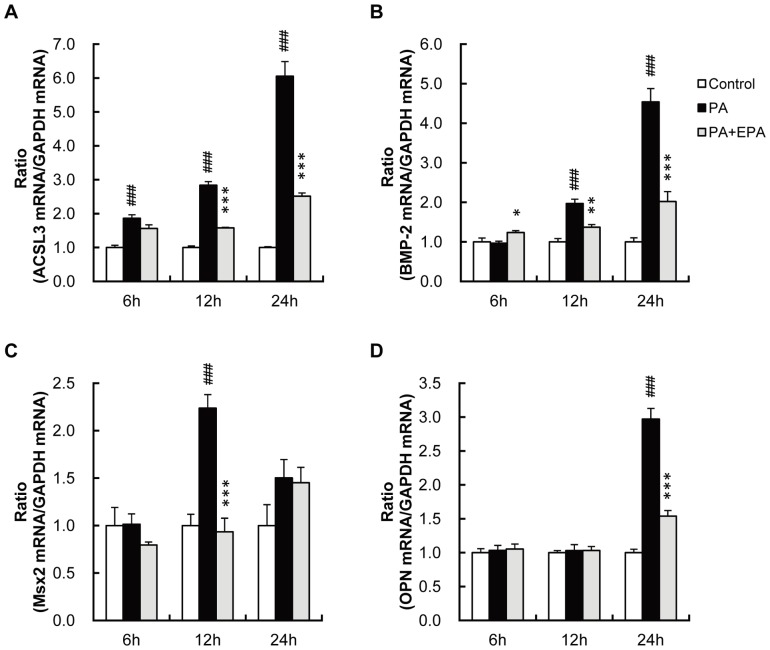
Figure 3. PA increases mRNA level for ACSL3 prior to that for osteoblastic genes in HASMC.
HASMC were treated with PA (250 µM) with or without EPA (15 µM). Expressions of ACSL3 (A), BMP-2 (B), Msx2 (C) and OPN (D). The mRNA levels at 6, 12 and 24 hours after treatment with PA and EPA were determined by real-time PCR and normalized to GAPDH. The control values are shown as 1.0. All values expressed by AU are presented as the mean ± S.E. (n = 4). ###p<0.001 vs. control, *p<0.05, **p<0.01, ***p<0.001 vs. PA.

