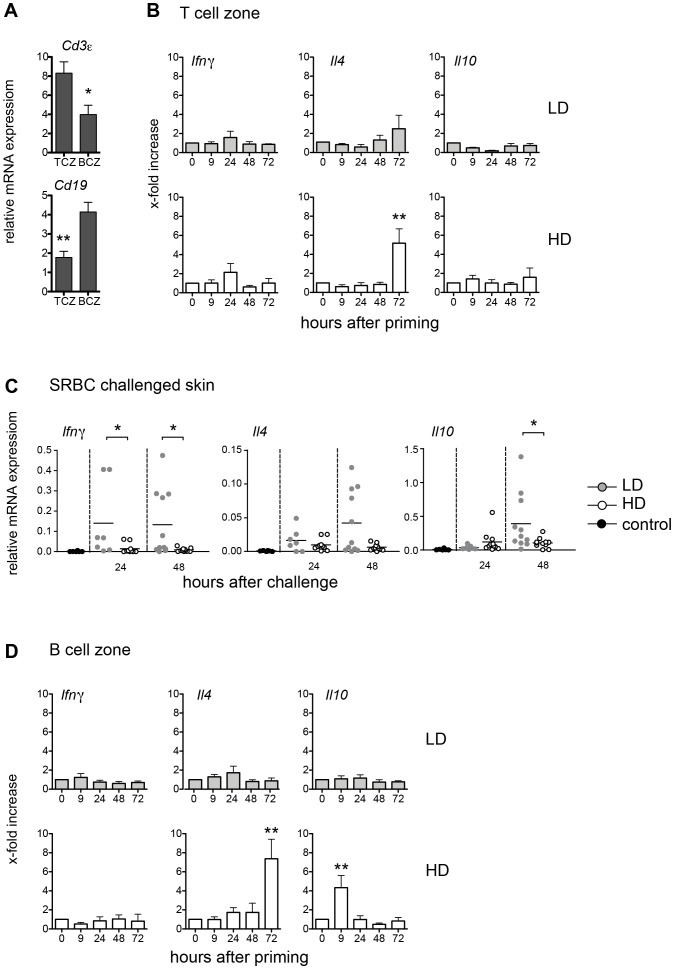
Figure 4. LD Th1 cells appear in the skin, HD Th2 cells in the spleen.
Mice were primed with a LD or a HD of SRBC intravenously. The spleens were snap frozen, sections were prepared and the TCZ and BCZ were isolated by laser-microdissection. To confirm that the TCZ and BCZ are accurately identified and high-quality mRNAs are obtained, we analyzed mRNA expression of Cd3ε and Cd19 after laser-microdissection (A). The mRNA expression of the Th1 cytokine Ifnγ, the Th2 cytokine Il4 and the marker cytokine for regulatory T cells Il10 was analyzed by real-time RT-PCR after isolation of the TCZ of the spleen. Data are means ± SEM. Data are normalized to Mln51 mRNA expression levels. Significant differences in the expression of Ifnγ, Il4 and Il10 between primed mice compared to the controls are shown (n = 6, from two independent experiments with n = 3 mice) (B). 5 days after priming one footpad was challenged with SRBC. Mice were sacrificed 24 and 48 h after challenge and the expression of Ifnγ, Il4 and Il10 was analyzed in the footpad skins by real-time RT-PCR. Each dot represents the expression level of one mouse. Corresponding means are depicted as black line. Significant differences between LD and HD primed mice are shown (n = 5–11) (C). The mRNA expression of Ifnγ, Il4 and Il10 was analyzed by real-time RT-PCR after isolation of the BCZ of the spleen, and depicted as described in A (D) (*p<0.05, **p<0.01, Mann-Whitney-U-test). Abbreviations: HD, high dose (109); LD, low dose (105).

