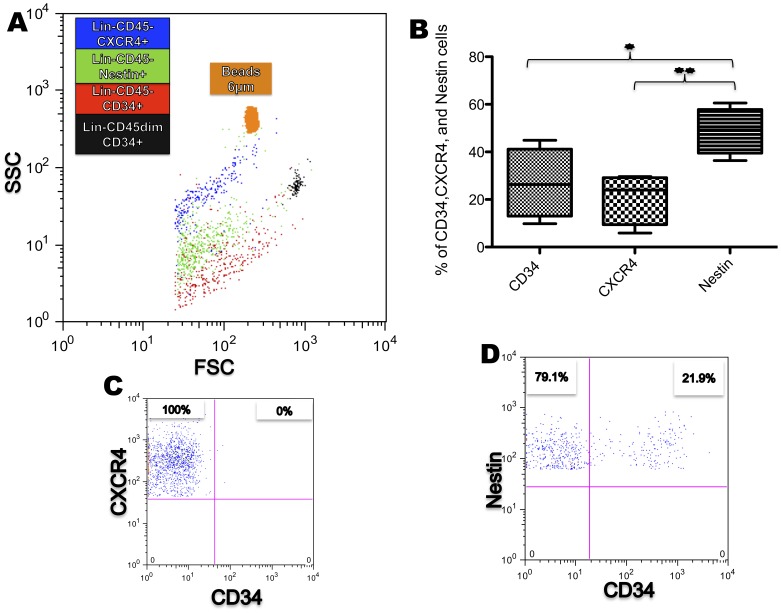
Figure 4. Heterogeneity of the Lin−CD45− population.
(A) SSC and FSC back gate show CXCR4+, CD34+, and Nestin+ subpopulations compared to specific size beads of 6 µm and the Lin−CD45dimCD34+ (black); they have the same range of size in FSC but are allocated differently in SSC. (B) The box plot shows the percentage of CD34+, CXCR4+ and Nestin+ cells; note that Nestin+ cells are the larger population within the Lin−CD45− cell fraction. (n = 4; *p<0.05/**p<0.005). (C) Gate shows that CXCR4+ cells are negative for CD34 (D) Gate shows Nestin+ CD34− and Nestin+ CD34+ cells. (C and D percentages represent the mean from 4 different samples).

