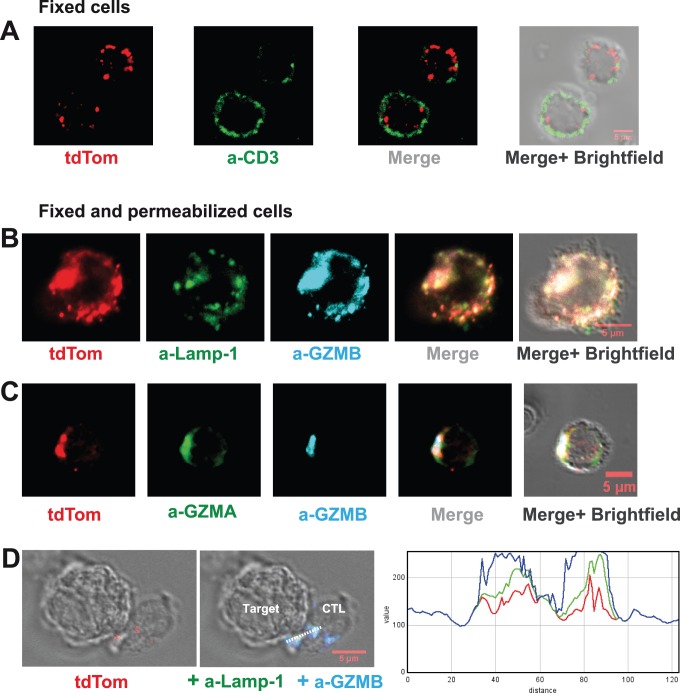
Figure 4. Analysis of GZMB-Tom-KI distribution in CTL by confocal microscopy.
GZMB-Tom-KI CTL were produced from LN T cells by a-CD3/CD28 stimulation (as in Fig. 3) followed by IL-2 expansion for analysis at day 8 of culture and treated as described in Materials and Methods. A: Cells were labeled with anti-CD3 (17A2-A647) before fixation and single fluorescence of tdTom (red) or anti-CD3 (green), as well as merged fluorescence images are shown. B-D: Cells were fixed and permeabilized for labeling with antibodies diluted in Saponin buffer. Labeling with a-CD107a (Lamp-1, 1D4B-A488, green) and a-GZMB (MHGB05-APC, blue) (B, D) or a-GZMA (3GB8.5-FITC, green) and a-GZMB (blue) (C) is shown as well as tdTom fluorescence (red) (B-D). In (D) CTL were derived from GZMB-Tom-KI/KI-OT1 mice (see Methods) and incubated for 25 min at 37°C with RMA-S target cells loaded with the OVA peptide (10−6 M). Histograms of an RGB line profile show colocalization of tdTom (red), a-Lamp-1 (green) and a-GZMB (blue). A-D: For evaluation of colocalization, variations of two fluorescence intensities were compared and Rr Pearson's coefficients were calculated (as in [39], and see Fig.S3). Rr = 0 (no co-localization) for CD3/tdTom (A); Rr around 0.65 (good colocalization) for tdTom/Lamp-1, Lamp-1/GZMB and tdTom/GZMB (B); Rr = 0.45 for both tdTom/GZMA and GZMA/GZMB and 0.60 for tdTom/GZMB (C); Rr around 0.7 for all 3 couples tdTom/Lamp-1, Lamp-1/GZMB and tdTom/GZMB in the CTL/target conjugates (D).

