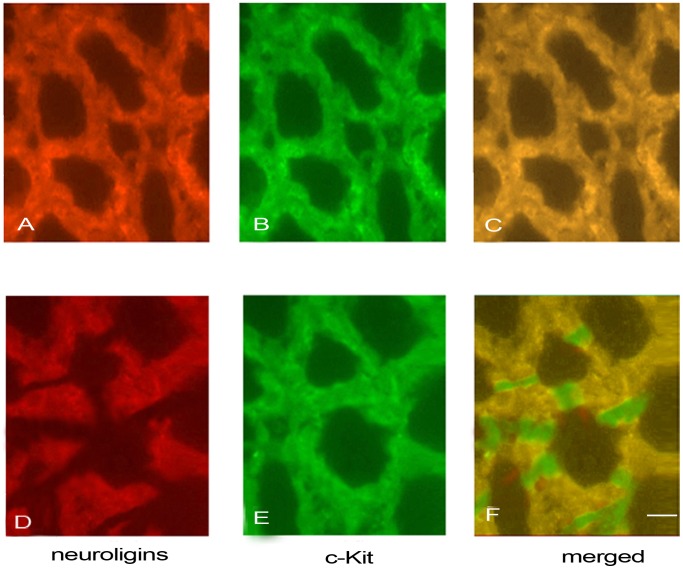
Figure 2. Double-labeled immunofluorescent staining of neuroligins and c-Kit was performed on LMMP.
Laser confocal microscope was used for observation. Figure 2A, 2B and 2C represented that in ganglionic segments, neuroligins (Figure 2A, red) were expressed in the same cells (merged, Figure 2C, yellow) in which c-Kit was expressed (Figure 2B, green). Figure 2D, 2E and 2F represented that in aganglionic segments, neuroligins (Figure 2D, red) were expressed in the same cells (merged, Figure 2F, yellow) in which c-Kit was expressed (Figure 2E, green). In aganglionic segments, the expression of neuroligins was down-regulated and neuroligins network was disrupted (Figure 2D), but no obvious disruptions of ICC-MY network were showed (Figure 2E). Scale bars:50 µm.

