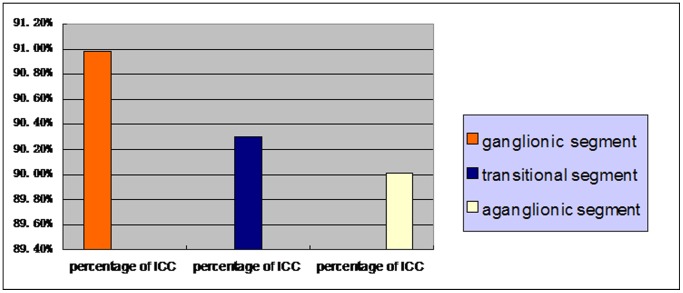
Figure 4. ICC-MY percentages of ganglionic, transitional and aganglionic segments from all 50 cases HSCR and the numerical data are presented as the mean±standard deviation (90.98±3.24, 90.30±3.09, 90.01±3.11, n = 50).
Statistical analysis was performed using T test, and P<0.05 was considered statistically significant.

