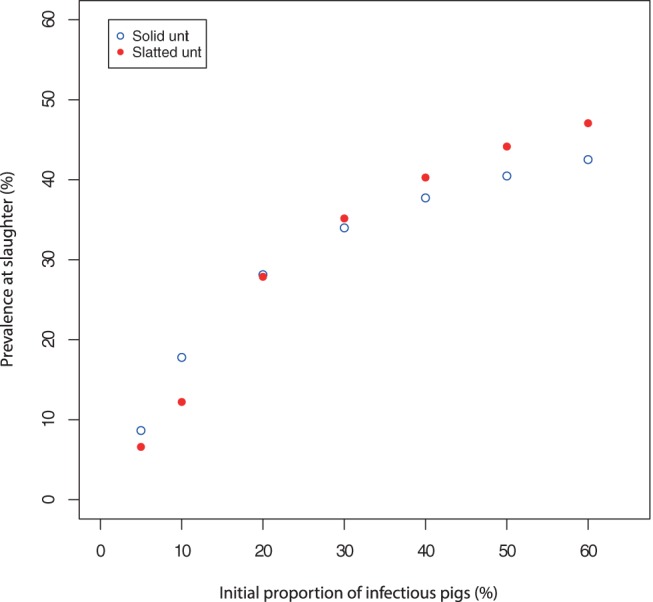
Figure 3. Average slaughter prevalence with varying levels of infectious animals entering the unit.

Results are based on model predictions from both the slatted and solid unit models.

Results are based on model predictions from both the slatted and solid unit models.