
Figure 7. The effect of the probability of infection ( ) on
) on  within the slatted unit.
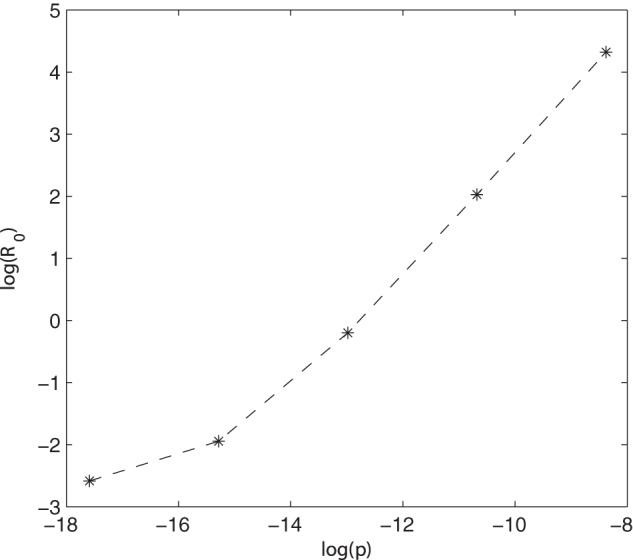
Natural logs were used, with base parameter log( ) =
) =  .
.
Official websites use .gov
A
.gov website belongs to an official
government organization in the United States.
Secure .gov websites use HTTPS
A lock (
) or https:// means you've safely
connected to the .gov website. Share sensitive
information only on official, secure websites.
) on within the slatted unit.
Natural logs were used, with base parameter log() = .