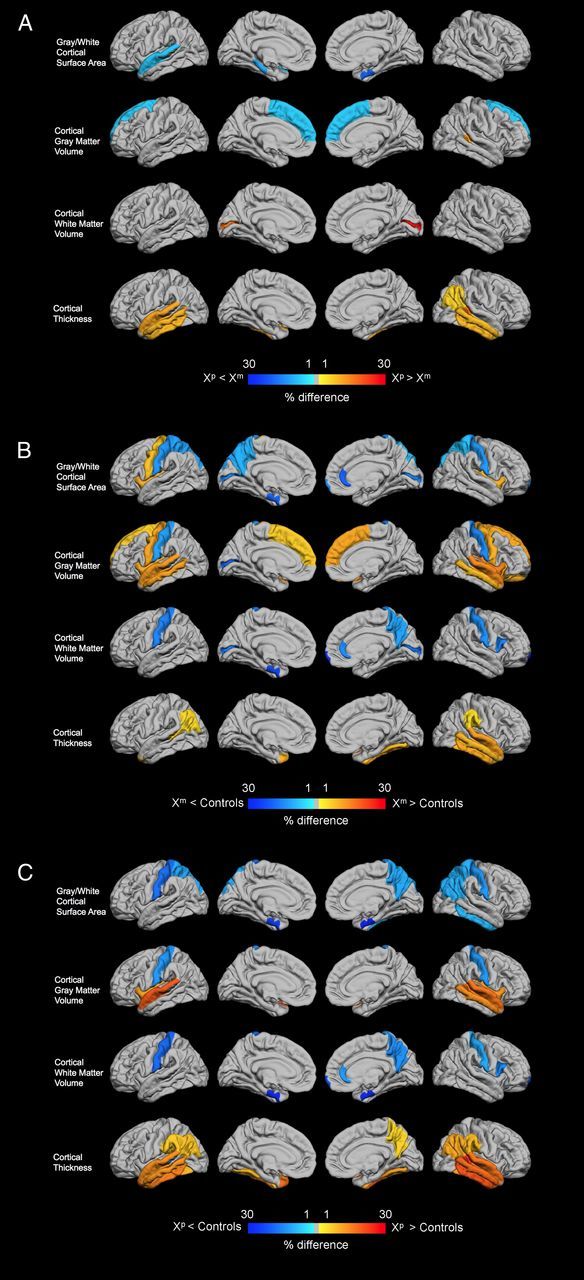
Figure 1.

Cortical regions showing significant differences between groups. A, Xp versus Xm. B, Xm versus Controls. C, Xp versus Controls. Colors show the percentage of difference between groups for each significant region. For comparisons with the control group, results are expressed in percentage change relative to controls. For comparisons between Xm and Xp, the comparison was made using Xm values as the baseline. Genomic imprinting effects are shown in A, where cold colors represent smaller values for individuals with Xp compared with Xm, and warm colors the opposite pattern. For B and C, cold and warm colors indicate, respectively, significantly smaller and larger values for Xm and Xp compared with controls. The rows of the figure correspond from top to bottom, to cortical surface area, GMV, WMV, and cortical thickness.
