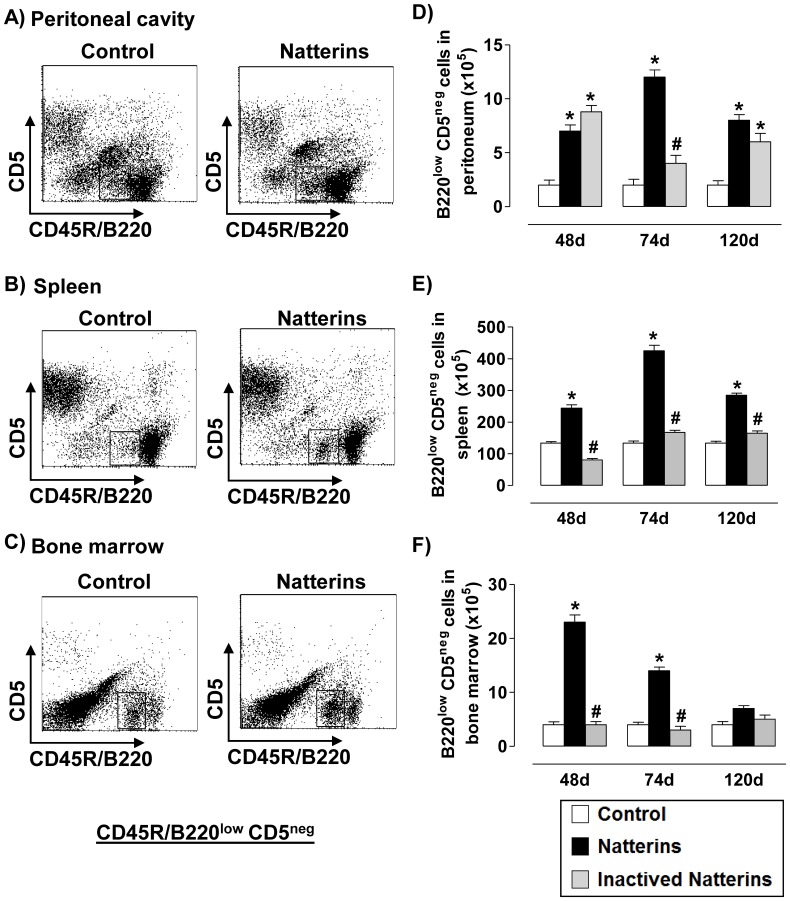
Figure 3. Natterins induce the B1b cell response.
A representative dot plot of B1b cells (B220posCD5neg from CD3-negative gated cells) obtained at 48, 74 and 120 d after immunization with active or inactivated Natterins is shown in peritoneum (A, D), spleen (B, E) and BM (C, F). The bars representative of the absolute numbers of B220posCD5neg cells were determined from total mononuclear cells by multiparametric flow cytometer using using Rat IgG2bk FITC-anti-mouse CD3, Rat IgG2ak PE-anti-mouse CD5, and Rat IgG2ak PerCP-Cy5-anti-mouse CD45R/B220. *p<0.05 compared to control-mice, and # p<0.05 compared to active Natterins.

