
Figure 5. Estimation of transversion accumulation rate in degenerate sites of VP1 coding region of Slovakian aVDPV2 strains.
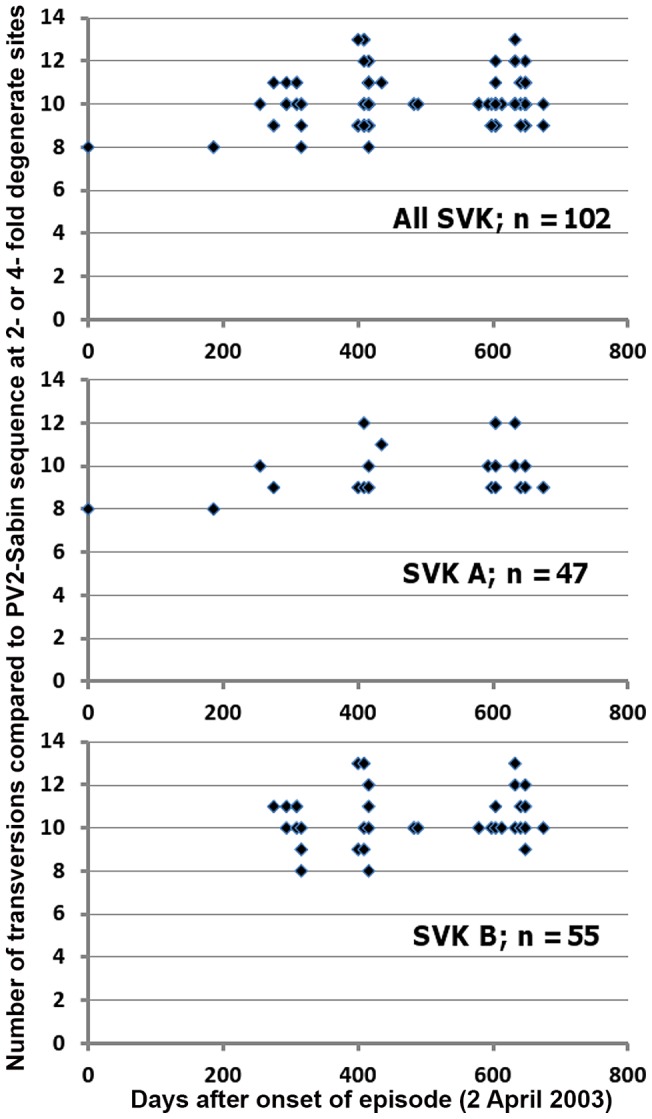
Calculations are based on substitutions occurring during the 22 months monitoring window in 2003–2005. Time in x-axis is given in days since onset of the episode, 2 April 2003. Y-axis indicates number of transversions in 2-fold and 4-fold degenerate sites compared to PV2 Sabin sequence. Multiple identical values at any two-dimensional point were omitted from calculation of linear regression coefficients (See Table 5). Entire sequence set (uppermost panel) and major clusters A and B were used as starting materials.