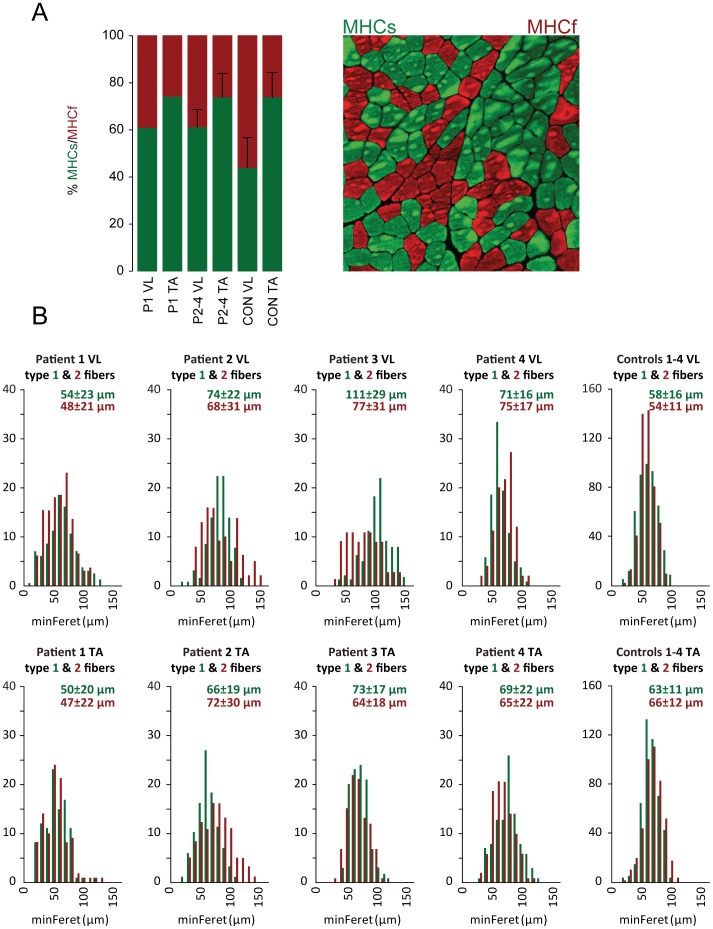
Figure 2. Immunohistology of muscle sections.
A. Myofiber composition of patients (P) to healthy control (CON) values detected by immunohistochemistry. B. Fiber size distribution of type 1 (green) and type 2 (red) fibers in vastus lateralis (top row) and tibialis anterior (bottom row) in patients and controls. Data is based on 100 fibers randomly chosen fibers of each fibertype in each patient and 400 fibers of each type in the controls. Fibers are grouped into bins of 10 µm. minimal Ferets diameter Mean ± SD is given above each histogram.

